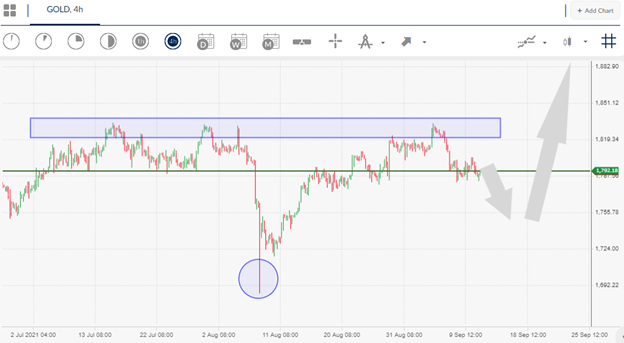
The price of gold suffered another upside rejection last week as the yellow metal failed to build on recent upside momentum, and eventually met a wall of technical selling around the $1,830 level.
No clear fundamental catalysts have been attributed to the pullback; however, I believe it could be to do with the large amounts of uncertainty towards what is happening with the economy and US fiscal policy.
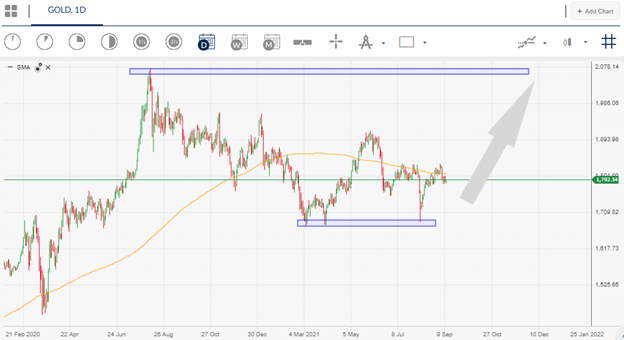
Gold currently needs to see more inflationary pressure and the pledge that the Federal Reserve will need to keep with its QE programme to encourage the much-awaited push back towards the $2,000 level.
Once we see the type of clarification needed for big players to decide what the FED is going to do we should then expect a long-lasting price trend to stick. For the time being, playing the established range between the $1,750 to $1,830 level seems appropriate.
I will also add that central banks have been purchasing huge amount of gold recently, and data has showed that this year has been an outlier in terms of the amount purchased. This obviously lends short-term support for gold price, meaning dips are probably for buying until the fundamentals become crystal clear as we should run with the marker momentum.
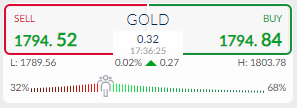
Current sentiment metric towards gold is currently suggesting further short-term losses are likely. The ActivTrader market sentiment tool shows that 69 percent of traders are bullish towards gold.


