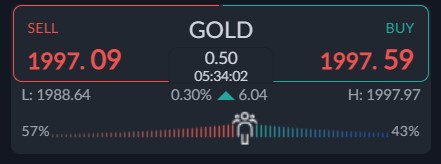
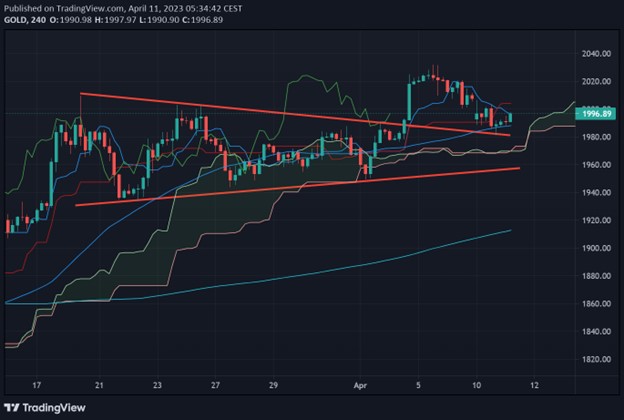
Gold continues to consolidate about the $2,000 level after the recent Non-farm payrolls job report heightened the chances that the Fed will increase interest rates at the May policy meeting.
Gold rallied towards the $2,040 area last in the aftermath of another bout of US dollar weakness and safe haven flows into the yellow metal after the collapse of Silicon Valley and Signature Bank.
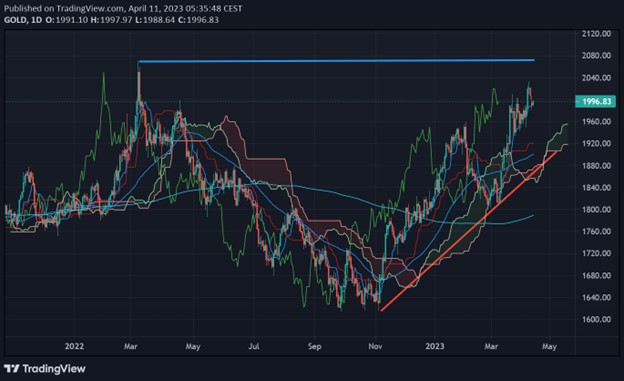
Gold is likely to remain in favour, and trade higher, as the US dollar slides lower and worries about economy could prompt further safe-haven flows into gold. Another development is also happening.
Talk has accelerated about other countries, such as the BRICS nations starting to shun the greenback. This situation is likely to accelerate as BRCIS nations pay for oil in alternative currencies.
In terms of the technicals if a dip does take place towards $1,900 I think gold is still in a major bull trend and traders will move steadily more away from the US dollar and move into gold.
With the yellow metal I think it will eventually hit $2,070 and much higher. I also think the next major buying opportunity could happen around the $1,900 to $1,860 area.
Current sentiment metric towards gold shows that sentiment has become more bearish all of a sudden, which hints that this current price action is probably bullish, but a correction may not happen.
The ActivTrader market sentiment tool shows that just 43 percent of traders are bullish towards gold. Going forward, we really need to see a much strong negative bias by retail to help the chances of a sustained rally to $2,070.
Gold short-term Technical Analysis
According to technical analysis gold the price of gold has moved above its 200-period moving average, meaning that the short-term price trend remains very bullish above the $1,900 level.
It is also noteworthy that gold has broken above the Ichimoku Cloud and the price now needs to move above the $2,010 and $2,035 levels to force the next major breakout. A move under $1,960 would be very bearish.
Gold Medium-term Technical Analysis
The daily chart shows that the yellow metal has moved back towards the $2,000 level and is now track back towards a two-year trading high, around the $2,070 resistance area.
We could see the price of gold making new highs if it ignites the cup and handle pattern as depicted in the chart below. Gold could explode above the $1,960 level and then the $2,000 level with relative ease.