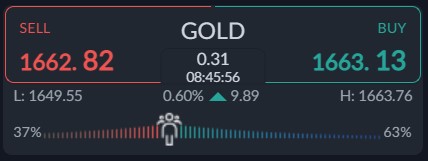
Gold prices have started to rally due a big decline in the US dollar index, which has largely been driven by the fact that the market is starting to believe that the Fed will soon pull back on rate hikes.
Due to the extremely week services PMI earlier this week the market has started to position itself for a pullback in aggressive Fed rhetoric. Even Treasury Secretary Yellen acknowledged the severity of looming economic recession.
The yellow metal has started to take on a safe-haven status also, as geopolitical events underpin the need for an alternative to US dollar accumulation. Other political events are also afoot.
Saudi Arabia recently made a power move to join the BRICS, which could be problematic for the US dollar. The US rely on the price of oil being priced in US dollars, if that changes it will create havoc for the greenback.
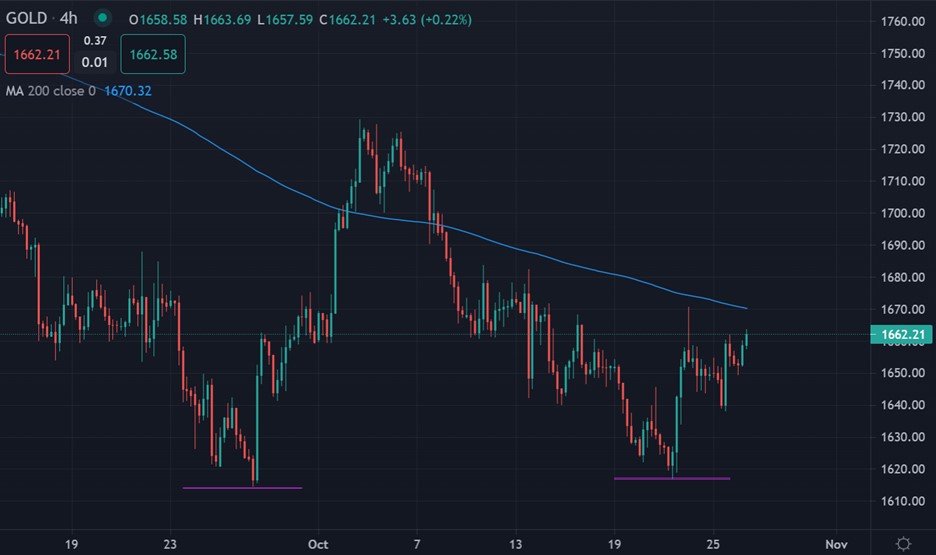
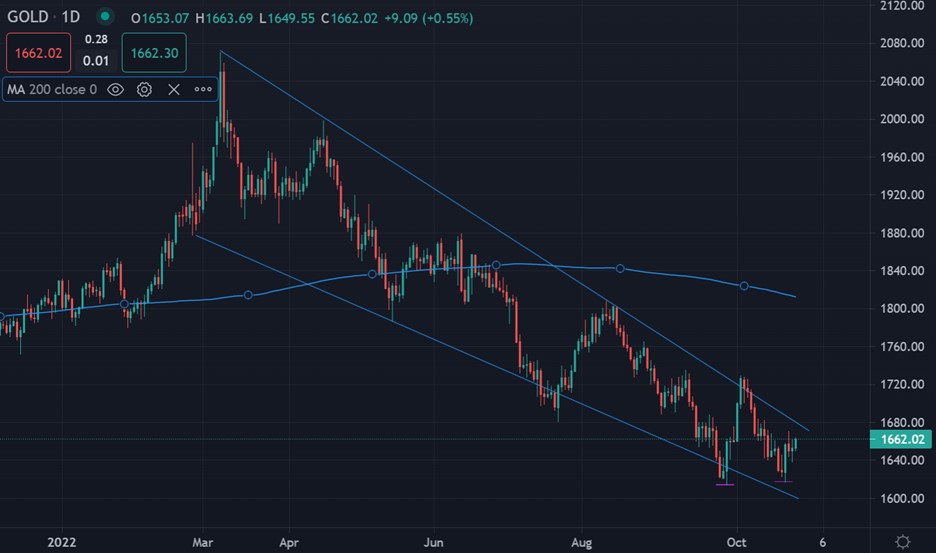
Technically, a breakout could be on the cards this week. A break of $1,680 may signal a retest on $1,720. As I mentioned last week, the most bullish development would be a move above $1,680.
With the economic calendar becoming more interesting due to the upcoming Fed rate decision and the US mid-term election results, gold could start to become very tradeable again.
Current sentiment metric towards gold shows that sentiment still remains bullish, which could hint at a gradual move higher in the price of gold.
The ActivTrader market sentiment tool shows that 63 percent of traders are bullish towards gold. Going forward, we really need to see a negative bias by retail to help the chances of a sustained recovery.
Current sentiment metrics may make do not make it difficult for gold price to rally, especially with this key tech levels now broken.
Gold short-term Technical Analysis
According to technical analysis gold the price of gold has moved back towards its trend defining 200-period moving average on the four-hour time frame.
According to technical analysis gold could receive more technical buy signs if the price starts to get comfortable above the $1,670 resistance level.
See real-time quotes provided by our partner.
Gold Medium-term Technical Analysis
The daily chart shows that the yellow metal has been rejected from a falling trendline last week. The trendline is basically the top of a falling price channel. These type of price patterns are known to be amongst the most bullish reversal patterns.
Looking at the bullish double-bottom pattern and the fact gold is approaching the top of the channel, we could see the price of gold moving towards $1,760 level, or even around the $1,810 if the price breaks above $1,680.
See real-time quotes provided by our partner.