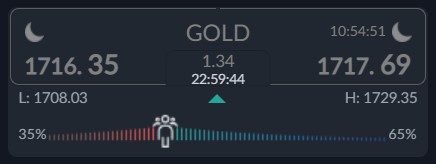
Gold prices are set for a pivotal trading week after rallying sharply on Friday ahead of this week’s main event, which will be the release of the United States August Consumer Price Index.
Gold prices could rise of the CPI data for the month of August mays show another subdued month-on-month inflation number, similar to July. The reasoning is that energy prices have since fallen.
However, once again, swings in energy prices, even if generally lower, may not be enough. Moves in food and housing will be closely monitored for signs that underlying inflation is easing as they are a priority for the FED.
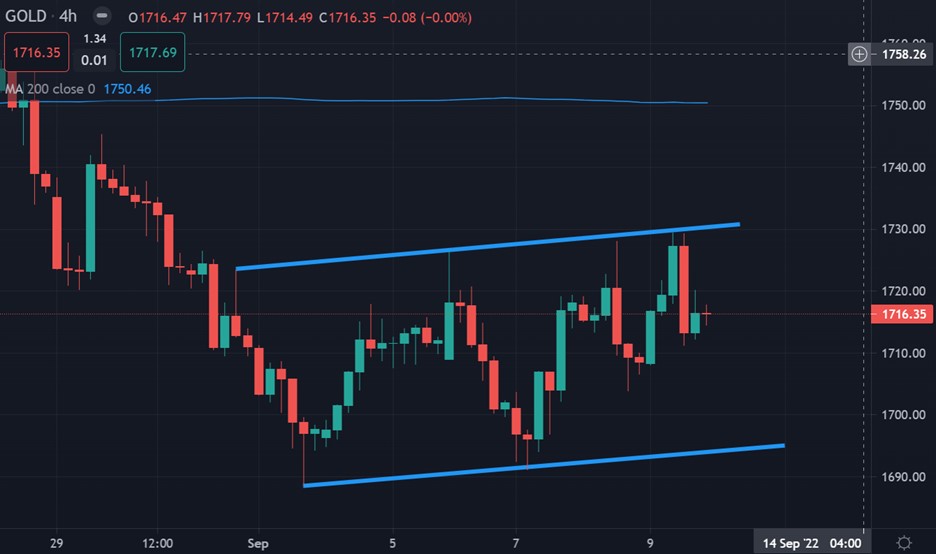
Another big driver for the price of gold will be the US dollar. This year the yellow metal has had an inverse relationship with the greenback. More upside in the US dollar index will be bad news for gold prices.
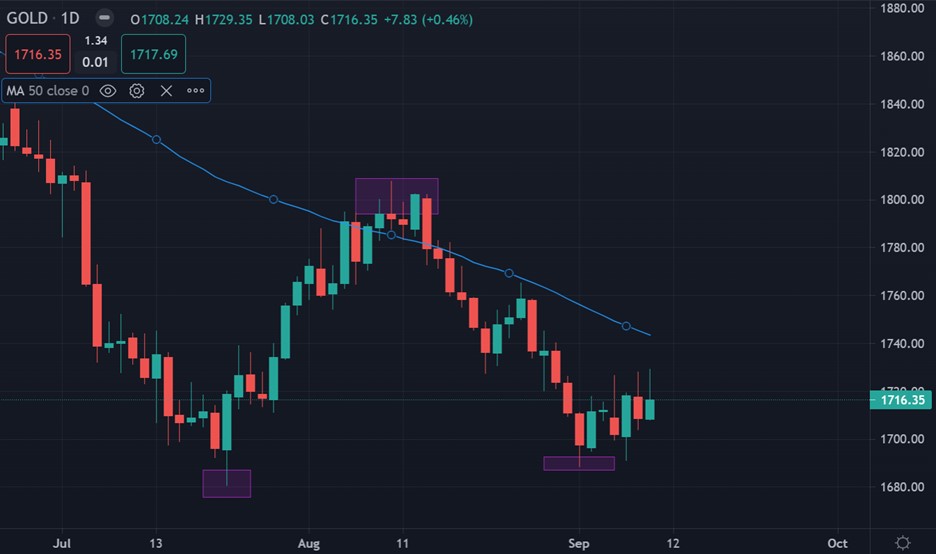
According to technical analysis gold bulls need to move the price above the $1,740 level to secure the prospects of the yellow metal in the short-term. In short, more upside is likely if the $1,740 level is broken.
Current sentiment metric towards gold show that sentiment has risen since last week, which could hint an eventual bearish reversal in the price of gold this week.
The ActivTrader market sentiment tool shows that 65 percent of traders are bullish towards gold. Going forward, we really need to see a negative bias by retail to help the chances of a stronger rally. Current sentiment metrics may make it difficult for gold price to rally.
Gold short-term Technical Analysis
According to technical analysis gold remains under pressure while trading below the $1,740 level. This means that the short-term trend is bearish while the price remains capped under this level.
The price of gold is also trapped in a flag pattern between the $,730 and $1,695 level. This implies that a $35.00 directional move is likely once gold prices breakout from the pattern.
See real-time quotes provided by our partner.
Gold Medium-term Technical Analysis
The daily chart shows that a bullish double-bottom price pattern has formed, and that gold is attempting to push higher based on this well-known bullish reversal pattern.
Looking at the bullish reversal pattern, at a very minimum, we could see the price of gold moving towards its 50-day moving average, around the $1,840 level. A break under the $1,690 level should be considered extremely bearish.
See real-time quotes provided by our partner.