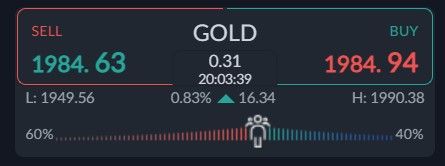
Gold continues to struggle with the $2,000 level, however, dips in the price of gold are still being bought aggressively, meaning that the likelihood of gold eventually breaking through $2,000 are high.
The yellow metal experience a brief dip at the start of the week after OPEC announced that it will cut the overall oil production by around 1.16 million barrels/day (bpd), which will lead to the overall pledge of production cut to 3.66 million bpd.
Gold moved because the move could be inflationary for the global economy, which would mean that the Federal Reserve may need to keep interest rate higher for longer than markets expect.
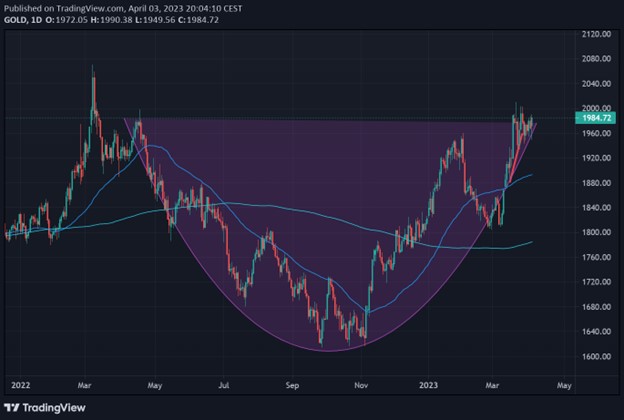
In a true sign of a bull market gold did not keep down long on the news about OPEC, further underscoring that gold is brewing for a breakout above the $2,000 that may be sustainable.
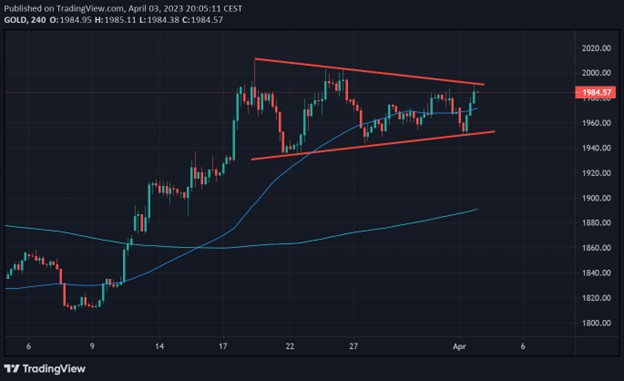
Gold has been struggling to break above the $2,000 level for a few weeks sometime, and the numerous failures have resulted in a triple top pattern forming on the short-term charts.
This could be setting a trap for sellers. When gold does finally breakthrough the $2,000 level we could see a near parabolic move that turbo charges gold into a much higher price range.


