The price of gold has staged a big move to the upside, as US bond yields continue to tumble and markets factor in increasing inflationary pressure down the road as the FED commits to ultra-low rates and its QE program.
Yesterday, precious metals started to break out sharply and finally follow the ongoing up move in raw commodities, such as lumber and wheat. With precious metals on the rise, a strong speculative bid is also starting to come into the market.
Today’s Non-farm payroll job report is only likely to derail the rally if we see a record-breaking headline number and a strong enough report which could cause the Federal Reserve to consider its current monetary policy.
In reality, the precious metals markets are more than likely going to focus more on inflation and yields now. Inflation components inside the report, such as wages and earnings are something that traders and investors watch very closely today.
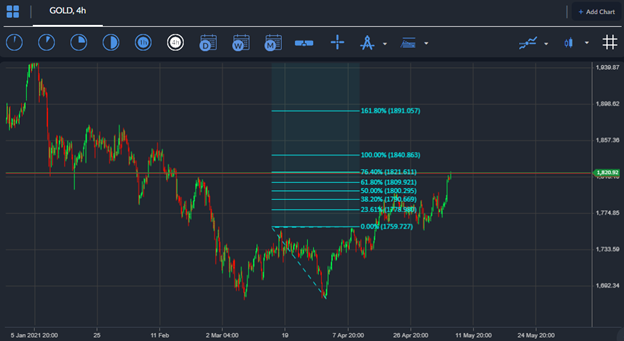
Futures market participants are pricing more upside in the yellow metal, while the spot market looks just as bullish right now. The strong trading volume surrounding spot gold right now sets the scene for further gains above the $1,800 level.
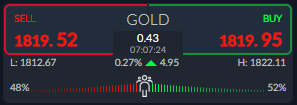
Current sentiment towards gold on the ActivTrader Market Sentiment tool shows that traders are slightly bullish towards gold. This could mean that further strong gains are likely, as we are not seeing a big bullish skew, despite the $50.00 price advance.


