Gold is struggling with the $1,800 resistance level as the new trading week commences, however, bulls still have a shot at taking the yellow metal higher due to its increasingly bullish technical set-up.
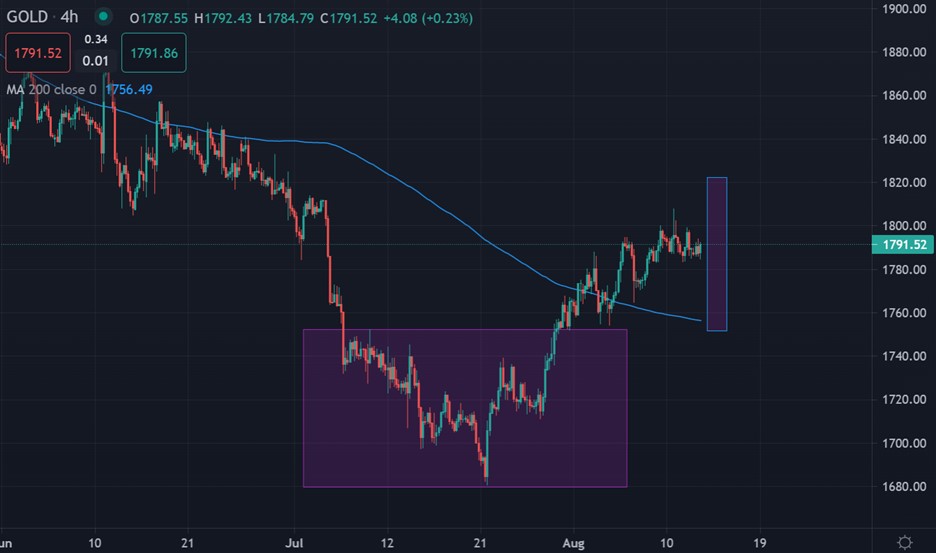
A bullish price pattern that has been playing out across the lower time frames recently has yet to meet its upside objective. The overall upside target of the mentioned pattern is around $1,820.
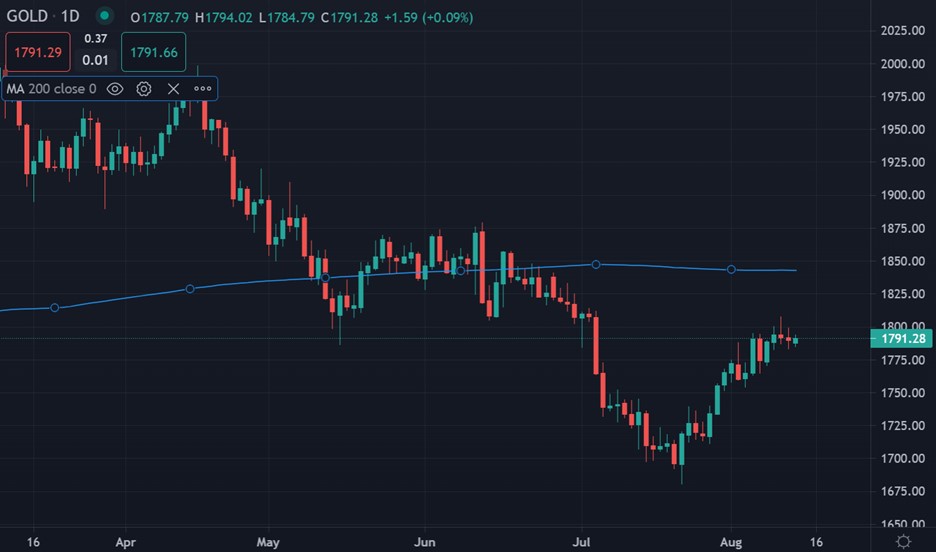
However, bulls have their eye on a large prize. And that it’s the 200-day moving average, which currently sits around the $1,840 level. After such a monumental rally it makes sense that bulls could target this area.
One of the big problems that gold currently has is the US dollar. The greenback is fighting back and refusing to turn lower, despite the best efforts of bears to crack a huge wedge pattern.
This week I would suggest keeping an eye on the $1,800 level. It has acted a huge market pivot over the recent week. If bulls can gain traction above $1,800 then further upside to $1,820 or $1,840 is likely.
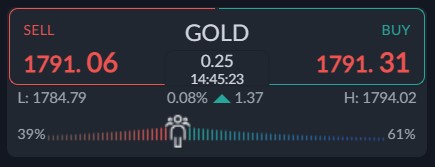
Sentiment is also a minor problem for the price of gold right now. The sentiment skew is getting more bullish, which is a negative force against a recovery in the price of gold this week.
Current sentiment metric towards gold show that traders are still bullish, although sentiment has dropped since last week. The ActivTrader market sentiment tool shows that 61 percent of traders are bullish towards gold.
Going forward we really need to see a negative bias by retail to help the chances of a stronger rally. Current sentiment metrics may make it difficult for gold price to rally.


