The price of gold surged alongside other precious metals after the US monthly jobs report came in much softer than economists had been predicting. In a high inflationary environment with the FED committing to ultra-low rates and its QE programme, gold looks set to shine further.
One of the key drivers for precious metals has been the Federal Reserve’s QE program. As long as the market believes that the FED is going to continue printing then a strong bid-tone is likely to remain in place towards gold prices.
A domino effect is currently in play across the commodity space. With many raw commodities going parabolic, speculators are turning their attention to metals with industrial value, and speculative monetary value, like gold.
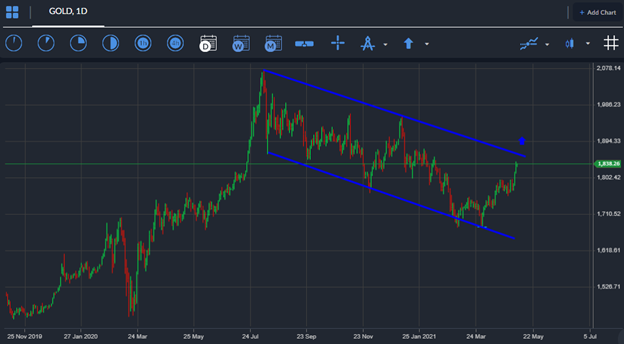
Copper hit a new all-time high on Friday, while silver bulls have their sights on $30.00, which has long been speculated to be a key trigger level for a parabolic run-in silver. Gold bulls are inching closer to the yellow-metals key 200-day moving average, around the $1,850 level.
Gold’s own trigger level is said to be $2,000. If gold were able to get above $2,000 then the yellow metal could also go parabolic and start to test big levels such as $2,500 and $3,000.
Concerns, and indeed more evidence of inflationary pressure is ramping up is likely to prompt more gains in gold if this week consumer price inflation report from the United States economy comes in hot.
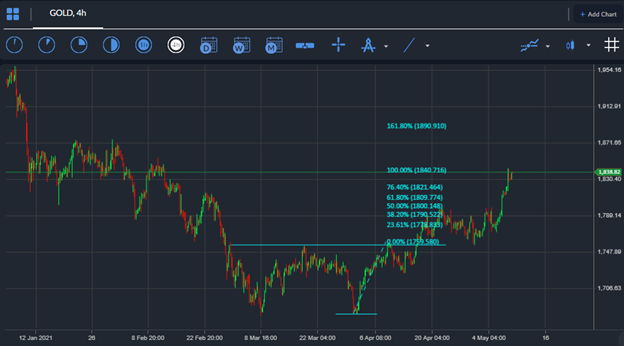
Dip-buyers may be rewarded if a pullback towards the $1,810 level. This was a key pivot point for gold earlier this year. So it makes sense that if the price of gold does pullback this week then this key spot may get a retest.
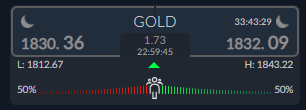
Current sentiment towards gold on the ActivTrader Market Sentiment tool is not giving many clues right now as sentiment amongst retail participants is evenly split. Watch out for further advance in gold if sentiment worsens while the price of gold heads higher.


