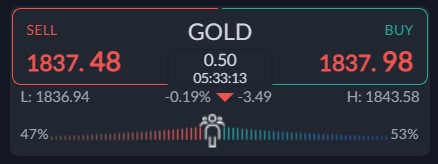
Gold is treading water at the start of the week as the yellow-metal looks to close the month of February with a lacklustre performance as the dip-buyers fail to show up around current trading levels.
A spike in United States. Treasury yields and strength in the US dollar weighs heavily on non-yielding assets such as gold and other metals at the start of the week as traders await the Fed minutes this week.
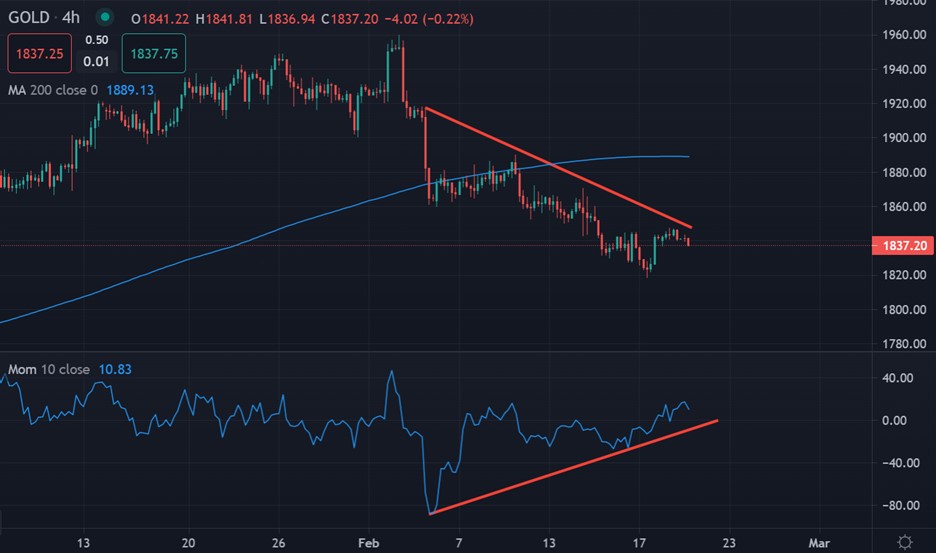
With US yields set to rise even further in tandem with interest rates, the near-term outlook for gold appeared bearish, as some Fed officials warned that US interest rates could rise past 6% this year.
Still, gold and other precious metals could benefit from safe-haven buying later in the year, especially if slowing economic growth forces the Fed into reversing its hawkish policy.
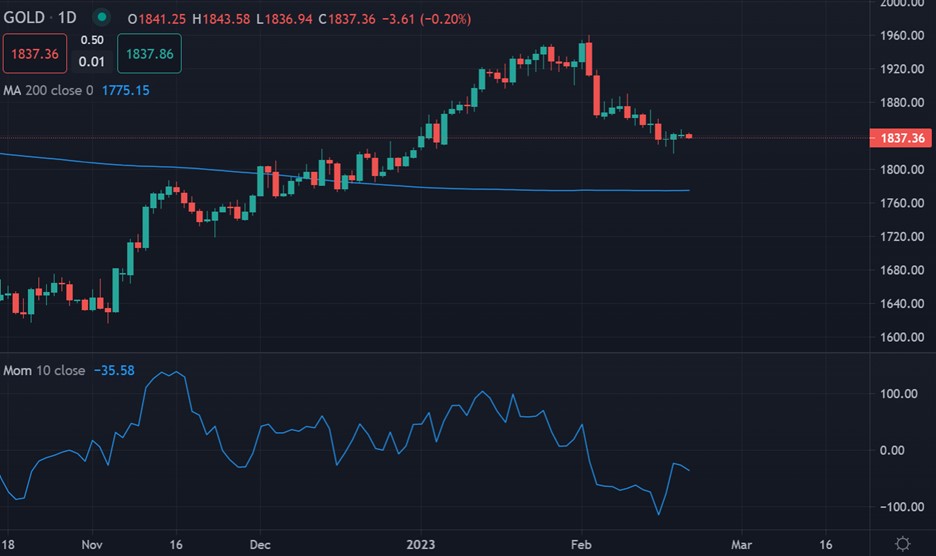
Technically, I would suggest keeping a close eye on gold’s 200-Day SMA. This could be the area to start to accumulate gold if a much-deeper price correction happens over the next few days.
Personally, I still think gold is in a major bull trend and traders will move away from the US dollar this year and move into gold, with the yellow metal eventually moving above the $2,000 level.
Current sentiment metric towards gold shows that sentiment has become slightly more bearish, which hints that this current price correction is probably not over just yet.
The ActivTrader market sentiment tool shows that 47 percent of traders are bullish towards gold. Going forward, we really need to see a much strong negative bias by retail to help the chances of a sustained recovery.
Gold short-term Technical Analysis
According to technical analysis gold the price of gold has moved lower after breaking under its 200-period moving average and this is confirmation that gold has turned short-term bearish.
It is also noteworthy that bullish momentum divergence has formed, which is likely to see a final moving towards the and then above the $1,900 resistance level. The Momentum indicator has been moving in the opposite direction of price.
See real-time quotes provided by our partner.
Gold Medium-term Technical Analysis
The daily chart shows that the yellow metal has moved back inside its two-year range and could test back towards its 200-day moving average, around the $1,770 support area.
We could see the price of gold revisit the $1,770 level if buyers do not soon start to show up. I think a bounce is coming from the 200-day and buyers are likely to accumulate gold for a target of $2,000. If $2,000 is broken then the sky could be the limit for gold, with $2,175 and $2,400 likely.
See real-time quotes provided by our partner.