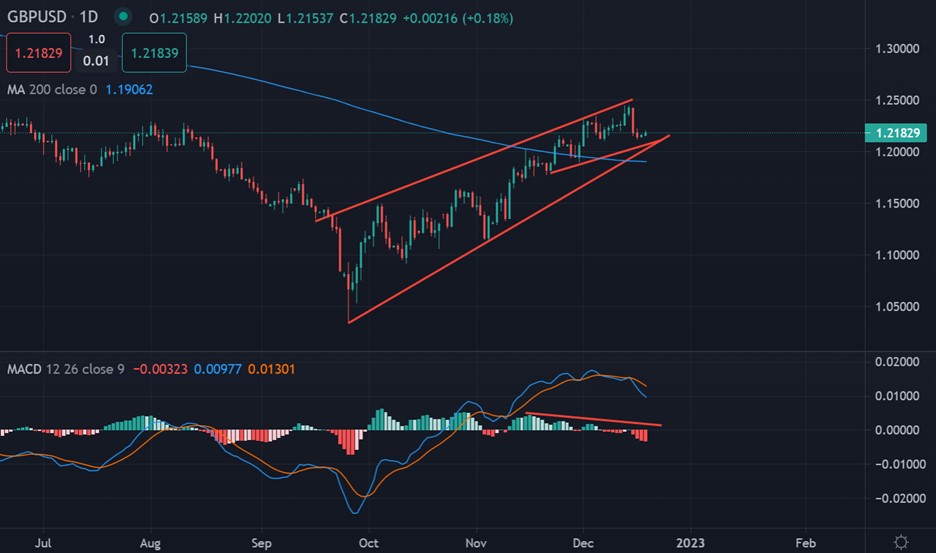
The British pound currency has continued to fall against the US dollar after more rate hikes from the United Kingdom central bank pushed sterling towards the 1.2100 level.
Additionally, the UK is facing economic stress and the prospect of health strikes across the country. So it can be said the mood has turned dark towards the GBPUSD pair.
Additionally, cross pair pressure also weighs on the British pound. The rising EURGBP pair is causing the British pound to generally underperform also.
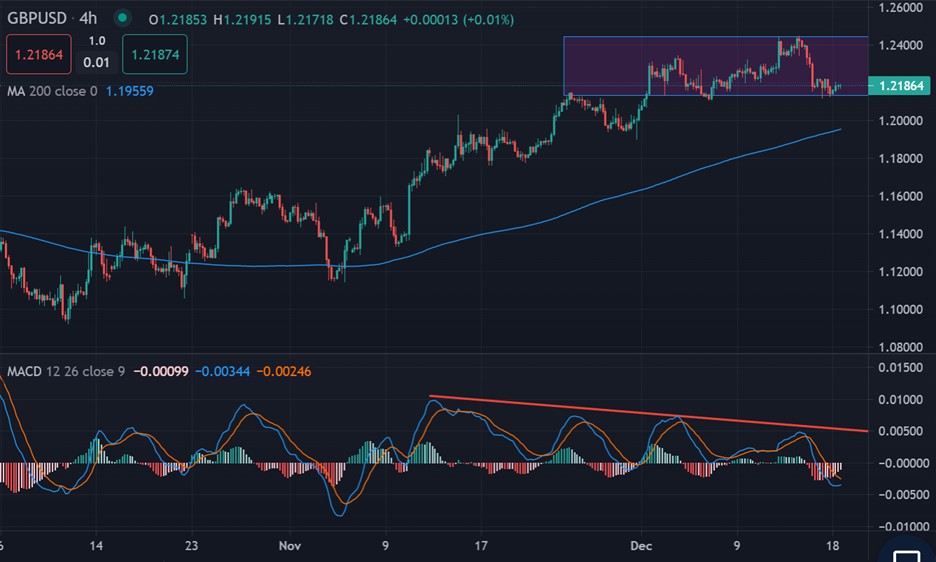
The fact that the GBPUSD pair has sunk so much over the last few days also hints that the GBPUSD pair has rewound from overbought technical conditions.
Speaking of the technicals, bearish MACD price divergence is also predicting the GBPUSD pair could start to fall well below the 1.2000 support level soon.
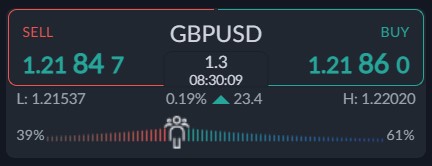
The ActivTrader platform also shows that the traders are bullish. The Market Sentiment tool highlights that 61 percent of traders are currently long sterling.
Typically, this is a bearish sign as we look to fade traders one-way sentiment. While it’s not so high, it’s still a potential bearish sign for GBPUSD.


