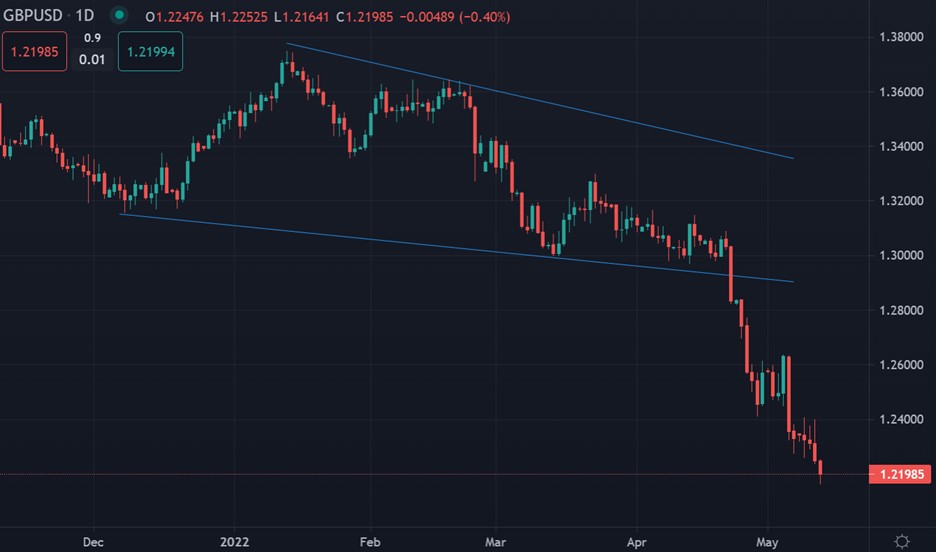
The British pound currency trades at a two-year low and continues its recent car crash against the greenback on the foreign exchange markets as the US dollar index buy trade remains the number one game in town.
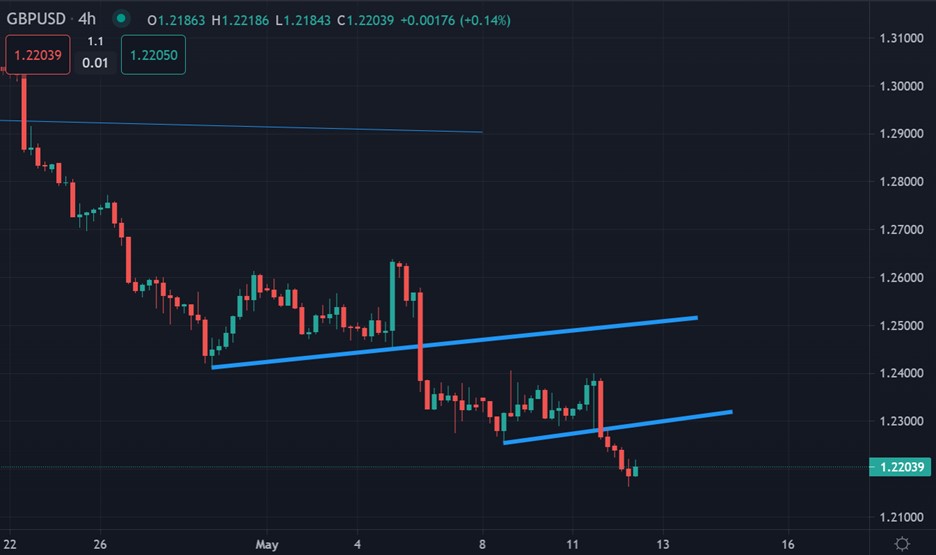
The GBPUSD pair continues its weekly slide from the 1.2400 mark and witnessed heavy follow-through selling towards the end of the week. Thursday’s sell-off in GBPUSD marked the sixth successive day in a negative move.
The British pound currency also took a major hit following the release of weaker UK macro data, which, along with sustained US dollar, and more dovish BoE has increased downside pressure on the GBP/USD pair.
The Preliminary UK GDP report showed that the British economy expanded by 0.8% during the first quarter of 2022 as against the 1.3% growth recorded in the previous quarter and the 1.0% anticipated.
Adding to this, the monthly GDP print also fell short of market expectations and came in to show that the economy contracted by 0.1% in March.
The subsequent break through the highs of March 2020 highs has been a major clue that more weakness is to come for the majors against the US dollar. The GBP, EURO, and antipodean currencies are all getting slammed against the buck.
Looking at sentiment data and how traders feel about sterling, the ActivTrader Market Sentiment tool shows that traders are currently still very bullish towards sterling.
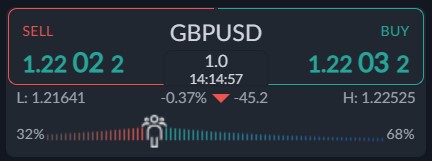


