The British pound currency looks set for further downside against the US dollar, as an ongoing upside breakout in the greenback against most major currencies appears to be just getting warmed-up.
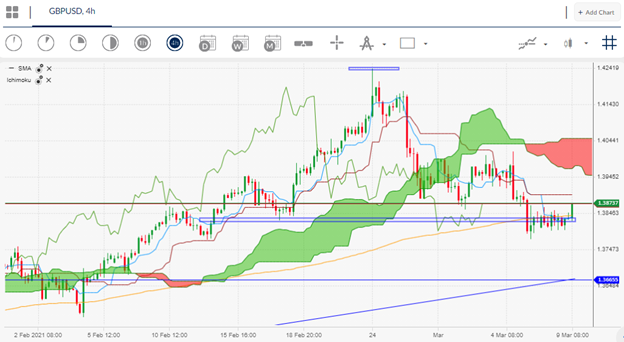
Failure to lift the GBPUSD back above the 1.4000 resistance level has opened the short-term downside potential for the pair, marking a potential short-term trend shift. In fact, according to technical analysis, the short-term trend is close to turn bearish.
The GBPUSD pair recently broke below its 200-period moving average on the four-hour time frame, although a bounce has since occurred. It is worth noting that the GBPUSD pair has managed to consistently trade above this key technical metric since October last year.
From a fundamental perspective the US economy does look set to perform well, given the recent jobs and manufacturing data, and the incoming boost that the $1.9 trillion stimulus bill will give to the American economy.
Yesterday, Bank of England Governor Bailey failed to lift Sterling from the doldrums as he noted that downside risks still remain in place for the UK economy. Governor Bailey also talked down the prospect of implementing negative rates.
With both economies hopefully coming out of lockdown over the coming months it is possible that both economies will fare well, however, the United States economy has the edge over the UK in terms of momentum and size.
With this in mind, sterling could continue to correct in the second quarter, however, the correction may be mild compared to other pair’s like the euro, which have significant scope for depreciation.
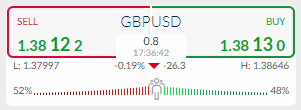
According to the ActivTrader Market Sentiment tool traders are basically neutral towards the GPBUSD pair at the moment. This may indicate that the GBPUSD pair could be carving out a range, but not a significantly lower one.
Should we see traders turning more bullish or bearish towards sterling, and a sentiment extreme building, it may be time to look to fade the crowd, whichever way the skew goes.


