The FTSE100 broke its four-week winning streak last week as traders became more cautious over the economic recovery in the United Kingdom, amidst uncertainty about how long the current lifting of the third COVID-19 lockdown will last.
News that President Biden is proposing a massive Capital Gains Tax hike in the US also spooked stock markets across the world, however, analysts in the United States noted that the proposal was unlikely to gain support when it is presented to the US Congress.
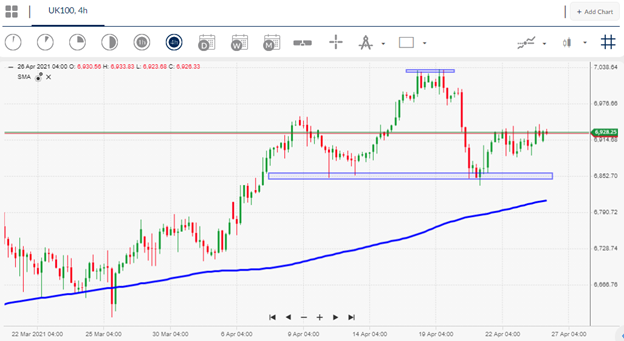
FTSE100 traders that are bullish towards the index have been left frustrated, after an encouraging breakout above the 7,000-resistance level at the start of the month. The sour note now for FTSE100 bulls is that the leading UK index is currently unable to hold above the 7,000 level.
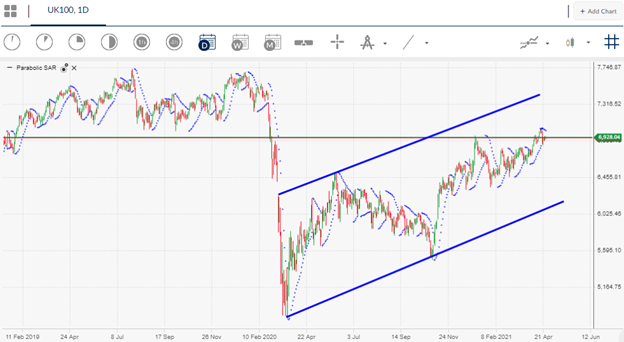
My personal opinion is that it will only be a matter of time before the FTSE100 starts to surge above the 7,000 level, and reach the 7,500 to 7,700 regions, purely based on the technicals, and abundance of bullish price patterns.
Another reason why the FTSE100 could be failing to rally right now is sentiment. The ActivTrader market sentiment tool currently shows that some 72 percent of FTSE100 traders are bullish right now.
Based on historical data, we need to see negative sentiment rising, and then look to fade the retail crowd. Until this takes place it could be a key reason why the FTSE100 is not rallying right now. It may be prudent to keep a close watch on retail sentiment over the coming days.


