The UK 100 remains trapped in a period of price consolidation as traders and investors await the next major directional move in the leading UK index. The is best highlighted by the ATR indicator, which shows that the index’s Average True Range on a daily basis is currently at its lowest level since February 2020.
Last week the FTSE100 underperformed in comparison to the S&P500, as the Biden administrations planned $2.3 trillion infrastructure plan propelled most of the leading index’s considerably higher.
The FTSE100 traded with a cautious tone last week, especially since many UK mining stocks remained under pressured due to the pullback in precious metals, while large oil companies, like BP, awaited the outcome of the OPEC meeting.
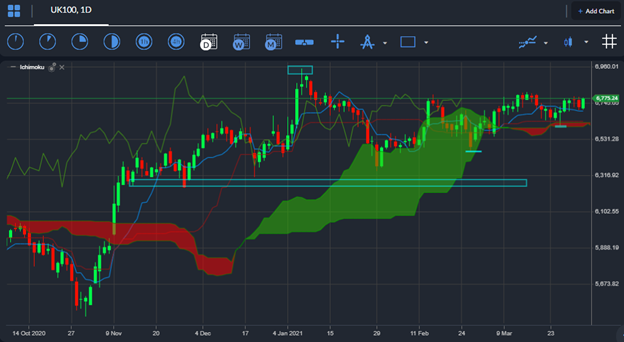
Going forward, the fundamentals and the technicals surrounding the FTSE100 look pretty solid, especially if we consider that the UK is starting to come out of lockdown, alongside parts of the United States.
While the ongoing lockdowns in Europe remain a drag, bullish sentiment towards the Biden administrations infrastructure spending bill and the UK economy could help the short to medium-term prospects of the FTSE100.
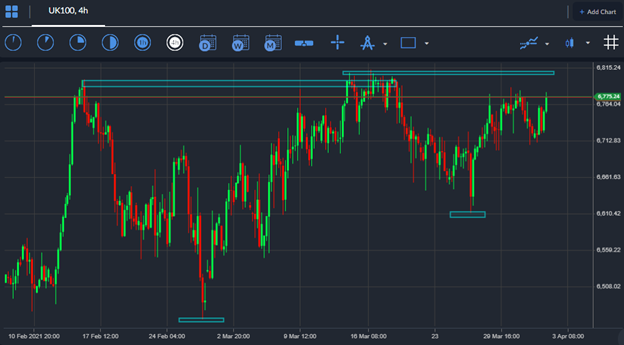
Something we may need to see in order for the FTSE100 to rally is a strong technical breakout, and sentiment shift, as buyers struggle to breach the yearly high, retail traders are overly bullish towards the index right now.
FTSE100 Sentiment Analysis
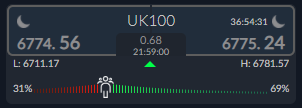
The Market Sentiment indicator on the ActivTrader platform currently shows that some 69 percent of traders are bullish towards the FTSE100 right now. This could indicate a level of short-term complacency, as traders incorrectly bet that the index will start to rally alongside other leading US index’s.


