The euro currency fell sharply towards the 1.0800 support level last week as market participants started to pay attention to the prospect of an emergency rate hike from the FED next month.
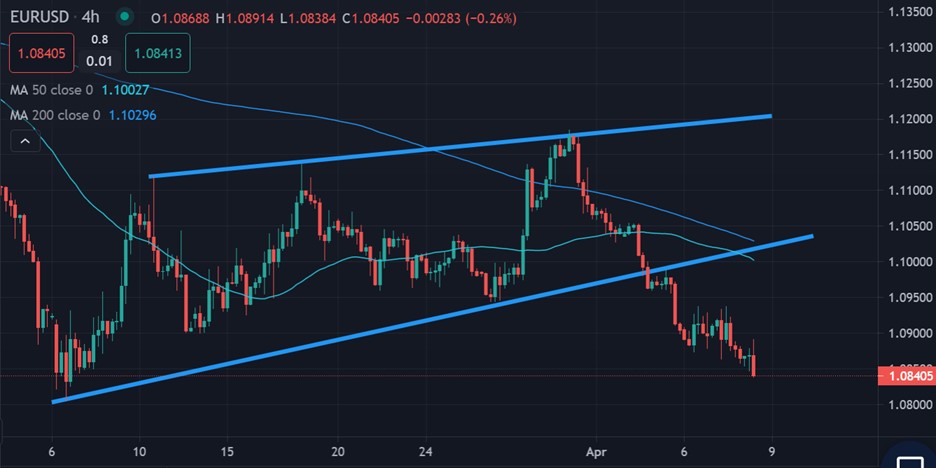
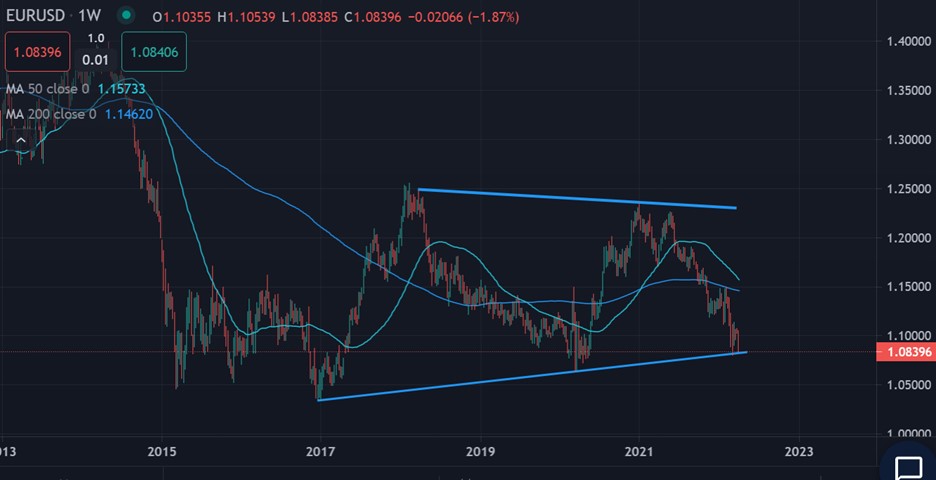
A technical breakout was clear on the EURUSD pair as it sunk towards the 1.0800 level and tested a key weekly trendline for only the second time since 2017.
The US dollar index looks like it’s clearly broken range after moving above 100.00 and is now storm towards the 101.00 area. I believe we could soon see 100.00 to 105.00 range.
If the EURUSD pair cracks the trendline from 2017 this week it has huge implications for the currency market, and if we see the EURUSD pair tumbling by over 1,000 points.
The lower time frame technicals are extremely bearish after a major trendline breakout yesterday. Additionally, sentiment is flagging more losses ahead this week.
Sentiment is in favour of more downwards trading this week. The ActivTrader market sentiment tool shows that some 75 percent of traders are currently bullish towards the EURUSD pair.
A 75 percent bias is very worrying and warning of more big losses. It is astounding that retail remain bullish while the trend is so clearly bearish here.
EURUSD Short-Term Technical Analysis
The four-hour time frame continues to show that the EURUSD pair broken under a massive broadening expanding triangle pattern, after moving under the 1.1000 area.
According to the four-hour time frame, and the overall size of the mentioned price pattern, the EURUSD pair looks like it is going to collapse towards the 1.0300 level.
See real-time quotes provided by our partner.
EURUSD Medium-Term Technical Analysis
Looking at the weekly time frame, the EURUSD pair has bounced briefly from the key 2017 trendline however, we are seeing now big reversal from the important trendline.
The 1.0800 level is the line-in-the sand for me this week. A move under this level and we could soon be looking at parity for the EURUSD pair this quarter.
See real-time quotes provided by our partner.