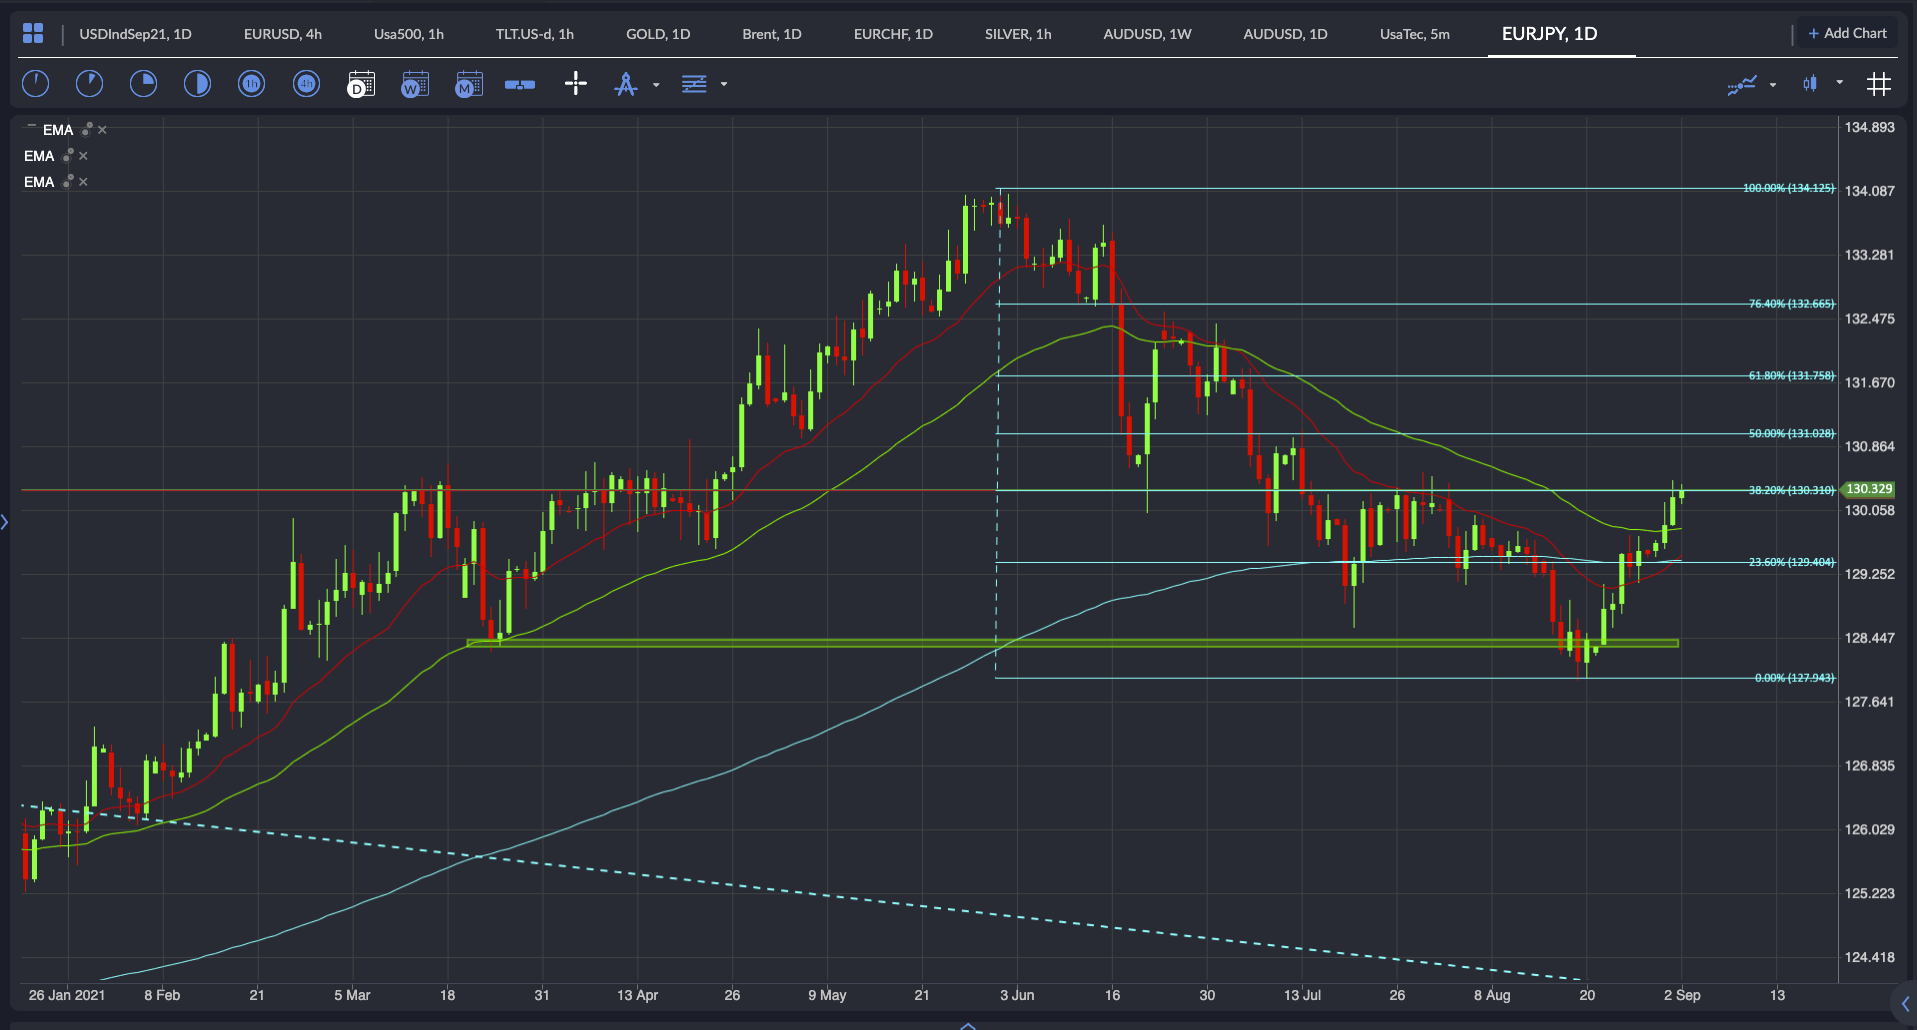
EURJPY Forex Analysis
The euro currency is gaining strength as macro events not only weaken the likes of the US dollar and Japanese yen but also make the euro look more attractive to the long side. As the coronavirus causes major disruptions to the Japanese economy which now sounds like it will lead to new stimulus measures and the persistent slack in the US labour force holding the Fed back from starting to tighten monetary policy, markets are now looking to the ECB and whether they will reduce their Pandemic Emergency Purchase Programme (PEPP). Todays Euro Area Producer Prices Index (PPI) rose 2.3% above the expected 1.1% and are adding to inflationary pressures. There is more money in the system from ECB chasing fewer goods, but manufacturing, durable goods and energy costs are pushing these prices higher. The Fed seems to think it is transitory so next week we’ll learn what the ECB believe.
There has also been rising speculation over when Japan will hold its general election which could be as early as mid-September. One thing the markets don’t like is uncertainty and political uncertainty usually means monetary policy uncertainty even if the central bank is supposed to be independent. With Germany being the driver of the European economic area their elections at the end of September will also feature in how well the euro does going forward.
US Treasury yields and the USDJPY are also sharing similarities when it comes to direction of travel. Often as the 10-year benchmark yield goes higher, the USDJPY follows. This can have some influence over the yen complex.
On the ActivTrader platform the retail traders are becoming more bearish in their sentiment towards the euro, even though the charts show that they have been on the wrong side of the trade recently.
See real-time quotes provided by our partner.
The new month has also already seen August’s highs get taken, which is the first monthly high to be traded in the last 4 months, which is the best way to start a new bull leg. The 20, 50 and 200 period ema’s are all below current price which means price action is above long- and medium-term momentum. Looking back there was a break of a corrective trend line at the start of the year signalling a move much higher had a higher probability in the coming months which is really starting to play out.
See real-time quotes provided by our partner.
One of the cleanest charts for the EURJPY is the Weekly, where support has been found at the 50-period moving average and a close above the 130.30 should encourage speculators to join in on the bull move as prices trade above the 20-period moving average. The sweep of the swing low from March may have been a stop run, with a move above the swing high from July confirming this idea.
See real-time quotes provided by our partner.
The daily chart is currently showing the previous balance area between 129.40 and 130.00 is acting as resistance and it’s not until price gets above the 50% retracement and the 131.00 level that market structure starts to think out. It will be easier going when the 20 ema is above the 50 and we start to see the pair stretch its legs as it was prior to this 2-month correction.
See real-time quotes provided by our partner.
For traders looking to get in on a long trade, the m30 chart is a great Breakout-Retest-Continuation (BRC) trade with the 200-period moving average an easy place to keep a check on your risk. Trailing the stops higher maybe the way to go due to the overhang of resistance on higher time frames, but if you get stopped out at least while this trend higher continues, there should be ample of opportunities to get back in.