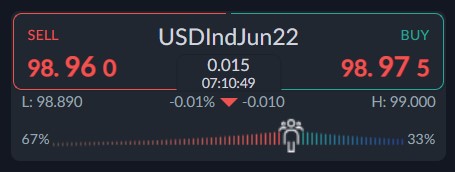
The US dollar index has been surging higher at the start of the week, due to the recent strong US jobs number, which further underscores that the US central bank is going to raise rates again at the May meeting.
A recent reversal around the 98.00 region has caused the traders questioning upside momentum, which started during the beginning of the Ukraine crisis to really get back on track.
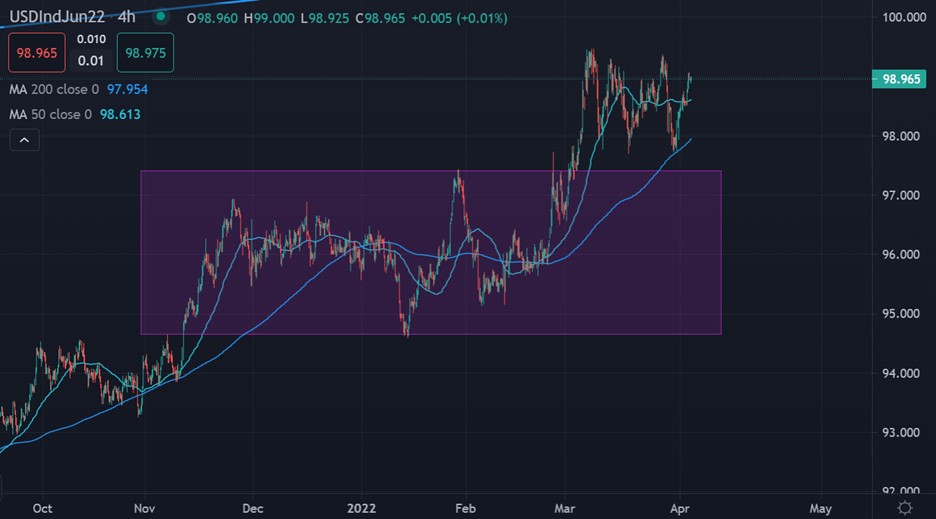
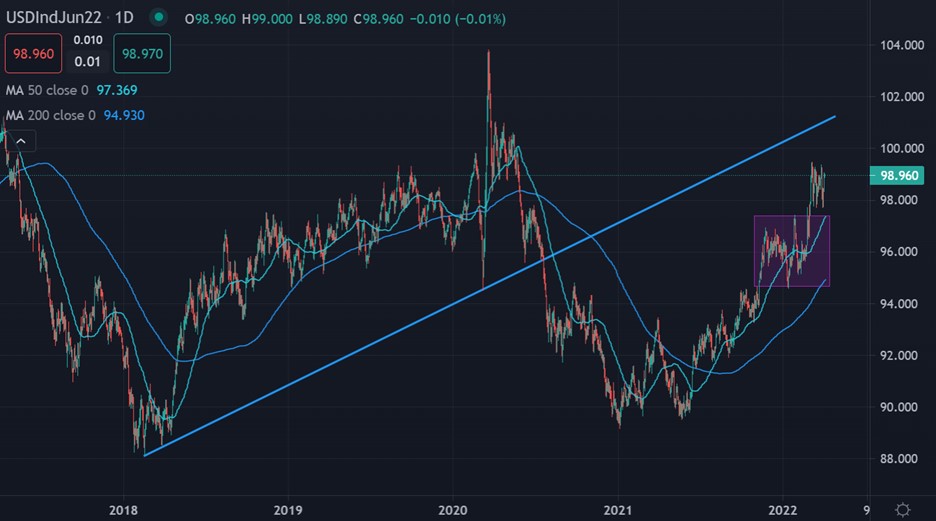
Looking on the charts the key moving averages are telling a compelling story. The US dollar index’s 50-day moving average has crossed over the 200-day moving average, which is known as a golden cross..
This is big problem for traders looking for US dollar weakness. Due to the advanced nature of the golden cross It is going to be incredibly hard to stop, due this powerful technical signal.
As things stand, weakness under the 98.00 level is likely to trigger more losses towards the 96.60 area. Far more likely is a break above the 99.50 area which exposes further gains towards the 100.00 price zone.
Over the coming days I would suggest keeping a close eye on the 99.50 to 98.00 support region. This is the big breakout or capitulation range. I would also suggest keeping a close eye on the EURUSD. Much below 1.0900 and the US dollar index could explode.
According to the ActivTrader Market Sentiment tool some 33% of traders are bearish towards the U pair, US dollar index, which may hint those further gains are coming as bearish sentiment is very strong.
This could become a big bullish constrain signal which is pointing to more USD gains, and we should also consider that while bond yields are breaking out this is further supportive for USD gains.
US dollar index Short-Term Technical Analysis
Technical analysis on the four-hour time frame shows that the US dollar index pair has invalidated a large head and shoulders pattern, which is still in the early phases of playing out.
According to the invalidated pattern the overall size of the pattern shows that US dollar index could be preparing to stage a move towards the 100.50 resistance area.
See real-time quotes provided by our partner.
US dollar index Medium-Term Technical Analysis
The daily time frame is showing that a bullish golden cross is underway, which was a key bullish breakout signal from earlier this year. The signal is still pointing to more gains ahead.
A test towards a multi-year trendline resistance, around the 101.00 area seems to be on the cards. I would suggest that the 100.00 to 101.00 appears to be the interim targets ahead.
See real-time quotes provided by our partner.