The US dollar index has started to accelerate to the upside again due to soft economic data and fears about a pending global economic recession after hitting the 110.00 level earlier this week.
Rising jobless data dented confidence in the recovery story and set up the risk-off play whereby we usually see the greenback gaining strength and stocks starting to move lower.
For now, in order for the uptrend in the US dollar index to really stick technically, we probably need to see the 110.00 area defended. This is former breakout resistance now turned support.
Additionally, a bearish head and shoulders pattern seems to be building across the lower time frames. If this is correct then we could see far more substantial losses in the US dollar index.
As always the job report from the United States economy will be critical and the unemployment rate figure will be equally important given the Fed’s preference for low inflation to continue hiking rates.
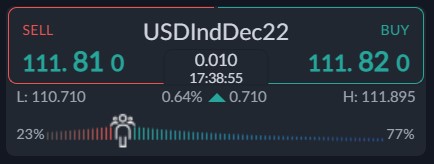
According to the ActivTrader Market Sentiment tool some 77% of traders are bullish towards the US dollar index, which certainly hints that retail could be in for more pain this week.
It should be noted that bullish sentiment has risen by around 5%, hinting at more pain for bears. I suspect if we break the 112.50 level then we could see more higher highs ahead.
Overall, with retail traders still very bullish we are probably going to see the US dollar index correcting lower at some point.
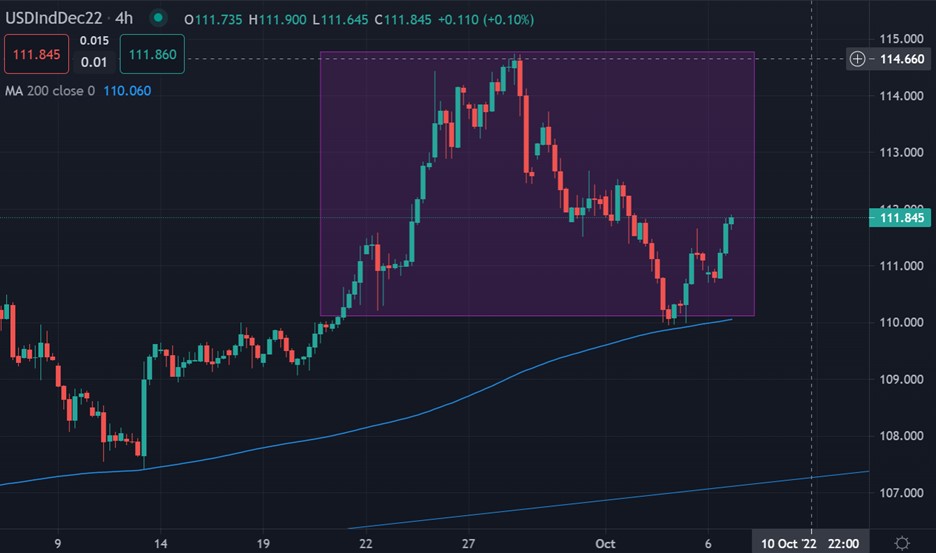
US dollar index Short-Term Technical Analysis
Technical analysis on the four-hour time frame shows that the US dollar index has ignited a head and shoulders price pattern which is located between the 110.00 and 114.70 levels.
The MACD indicator show negative price divergence forming down towards the 109.00 area. I think we could well see this divergence reversed before the next major push higher commences.
See real-time quotes provided by our partner.
US dollar index Medium-Term Technical Analysis
The daily time frame is showing that US dollar is basically been rejected from a huge ascending broadening wedge pattern. These patterns are typically bearish reversal pattern.
I expect more downside while the price holds under the top trendline of this pattern. The overall price target is located close to the 107.00 support level and then the 98.00 level.
See real-time quotes provided by our partner.