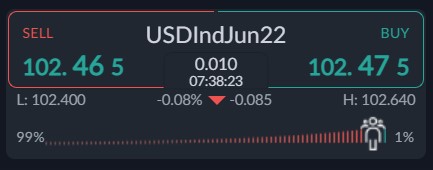
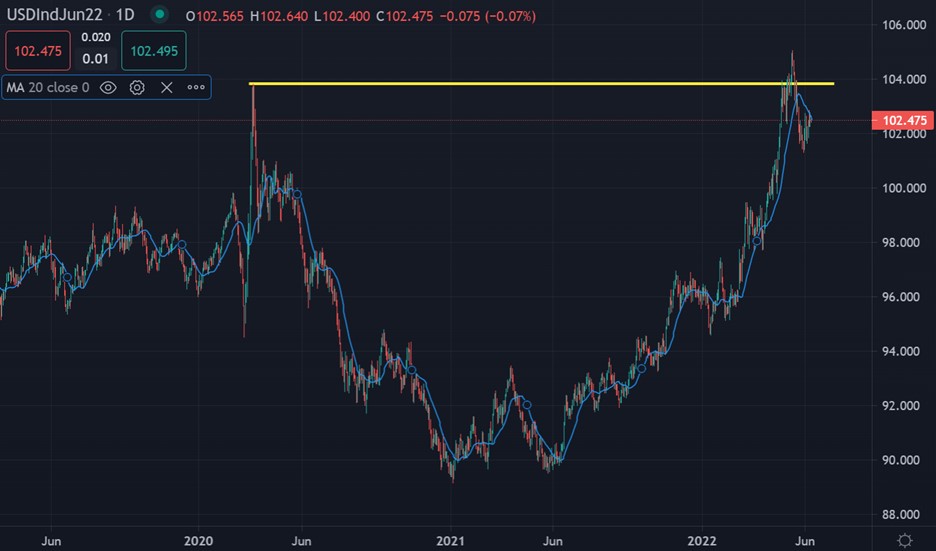
The US dollar index is starting to consolidate around a number of key moving averages ahead of the ECB rate decision and the release of the United States CPI inflation report on Friday.
A consensus is building that the ECB will not engage in a rate hike until next month. However, traders are preparing themselves for surprises and the direction of the pair is choppy between 1.0750 and 1.0550.
Potentially, the big move in the greenback to the upside could come to the upside if we see no action from the ECB today and a red hot inflation number from the United States in May.
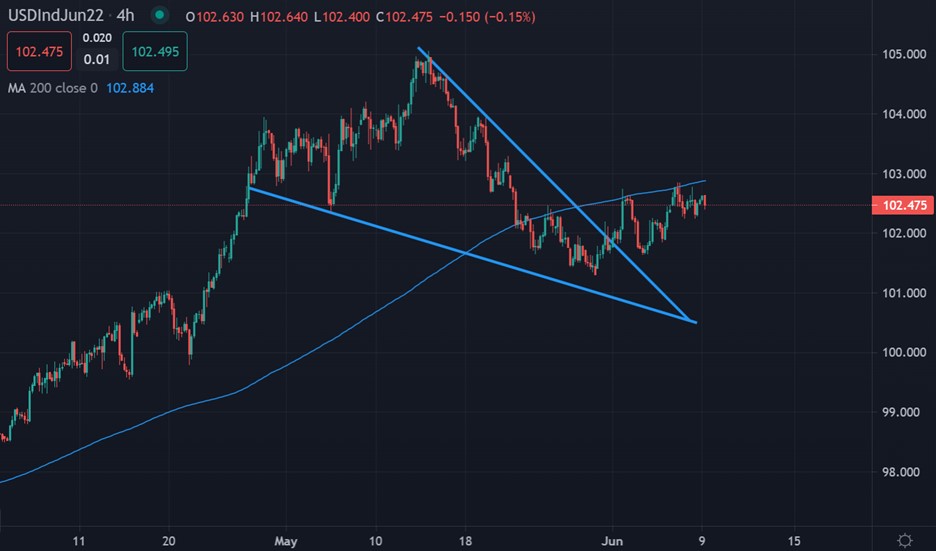
In this scenario a strong breakout to the upside is likely. Economists at Credit Suisse expect DXY to climb towards the 109.25/110.25 region, which is a huge 700-point climb from current levels.
Credit Suisse notes “We remain of the view recent weakness has been corrective only. Above 103.93 should add weight to our view for a move back to the 105.01 current cycle high. We continue to look for an eventual sustained move above here for a move to 109.25/110.25 next – the 78.6% retracement of the 2001/2008 bear market and September 2002 high.”
The banks technical team also note that in the interim “Support at 101.49/05 ideally continues to hold further setbacks if seen. A break would warn of a deeper albeit still corrective setback to price support at 99.82/42.”
According to the ActivTrader Market Sentiment tool a huge 99% of traders are bearish towards the US dollar index, which strongly hints those further gains are coming as bearish sentiment is growing.
This is bullish contrarian signal is pointing to more USD gains, it should be noted that bullish sentiment has largely exploded higher since last week, which could hint at more upside.
US dollar index Short-Term Technical Analysis
Technical analysis on the four-hour time frame shows that the US dollar index pair has corrected higher from the 101.24 area and is now starting to form a bullish pattern breakout.
A bullish wedge pattern breakout is underway, and according to the overall size of the bullish reversal pattern, it shows that the US dollar index could be preparing to stage a move towards the 104.00 resistance area.
See real-time quotes provided by our partner.
US dollar index Medium-Term Technical Analysis
The daily time frame is showing that US dollar index has briefly breached a key multi-year trendline, although it has still failed to rally past the 2017 high with conviction and make more strong price gains ahead.
A sustained move above the Index’s 20-day moving average would turbocharge a surge in the US dollar index, however, we need to see the US dollar index continuing to hold above the 20-day moving average on a multi-day basis and move past trendline resistance.
See real-time quotes provided by our partner.