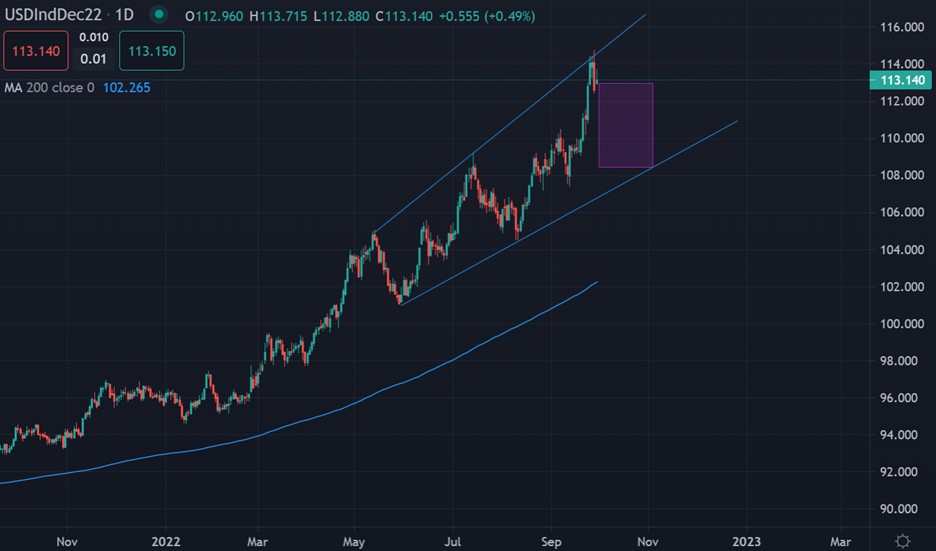
The US dollar index has reversed from a fresh multi-decade high, around the 114.70 level, following a huge parabolic run the index as it gained nearly 400 points in less than one week.
Some signs are starting to emerge that a possible price top has formed. The speed of the reversal certainly hints that a major round of profit taking took place as the index looked overstretched.
Typically, when we see parabolic moves higher in asset classes they have a habit of reversing sharply after the move take place. Subsequently we are also seeing signs of a price bottom in EURUSD and GBPUSD.
On the other hand, the index could continue to advance to 120.00 according to technical analysis if the 115.00 resistance level started to break. This is the next benchmark level to watch.
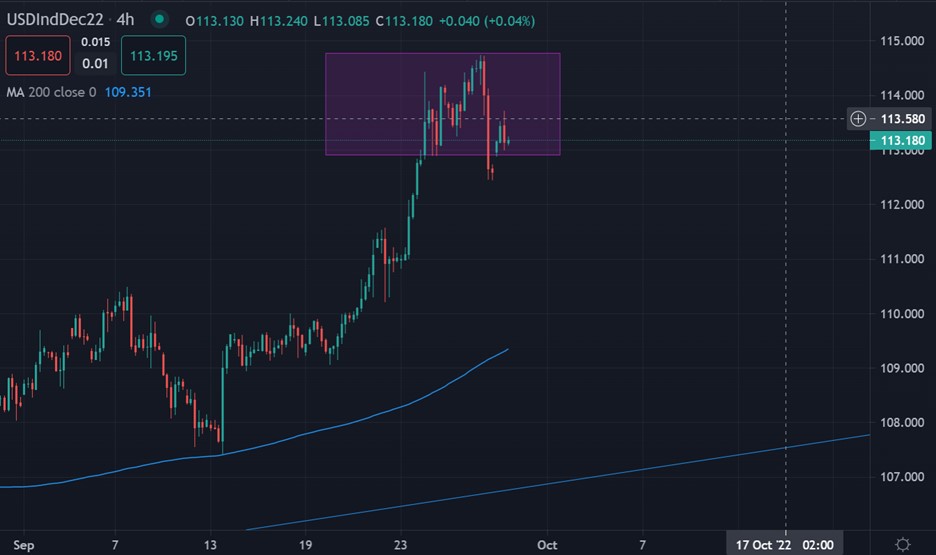
I would suggest keeping a close watch on the 112.00 to 115.00 price range. Once we see a breakout from that range I suspect we will know whether the trend reversal is real or just a pause within a much-larger bull market.
According to the ActivTrader Market Sentiment tool some 49% of traders are bearish towards the US dollar index, which certainly hints that things are starting to wind down in terms of bearish bets.
With this type of sentiment bias the US dollar index could start to stabilize over the coming weeks before the next big price move happens. If sentiment turn bullish then I think more losses are coming.
US dollar index Short-Term Technical Analysis
Technical analysis on the four-hour time frame shows that the US dollar index could be forming head and shoulders price pattern which is located between the 114.70 and 112.50 levels.
According to the overall size of the typically bearish pattern it shows that the US dollar index could be preparing to stage a move of around 220 points. I think the 110.50 looks like a probable target.
See real-time quotes provided by our partner.
US dollar index Medium-Term Technical Analysis
The daily time frame is showing that US dollar is trading within a huge rising broadening expanding wedge pattern. These patterns are known to be amongst the most bearish patterns.
If the price holds below the top of the wedge then we could reasonably expect a move towards the bottom of the wedge. This currently sits around the 108.00 support level.
See real-time quotes provided by our partner.