The oil market has been exceptionally volatile over the last few weeks as financial markets go through a series of extreme price movements as traders and investor start to position and reposition into the monthly close, and the end of the fiscal quarter.
All the major asset classes and financial market sectors have been undergoing similar volatility alongside crude and brent oil this week. For example, the US dollar has been breaking higher furiously on the foreign exchange market against most major currencies, while the major indices in the United States have been fluctuating in and out of the red.
The VIX CBOE volatility index, a key measure of market volatility, spiked to its highest level in two-weeks yesterday, with a 24 reading. It should be noted that the current high for the year on the VIX is a touch over 37.
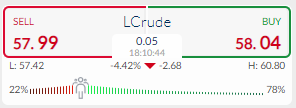
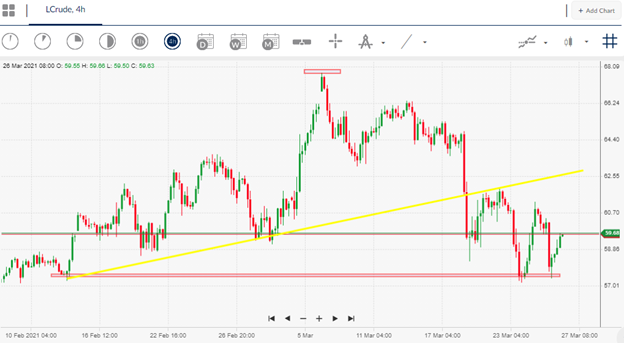
Crude oil has recently been smacked down from the $60.00 benchmark level and is now testing back towards the current monthly price low. At current prices crude oil is down by nearly $10.00 from its monthly high.
Fears over an ongoing container ship blockage in the Suez canal and falling global demand due to rising COVID-19 has significantly hurt the bullish case for oil. The oil market started to show cracks last weeks after appearing rock solid around yearly highs for a number of weeks.
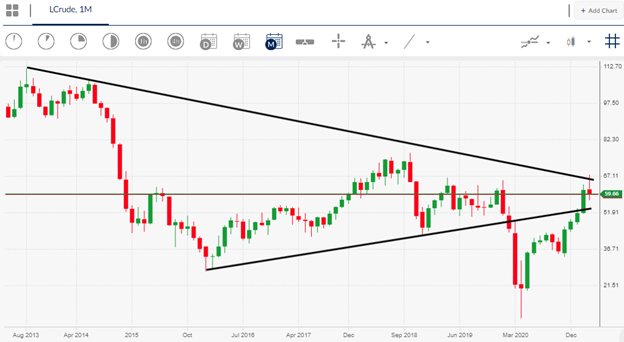
The technicals surrounding crude oil are extremely negative at the moment, and even more so if bears take-out the monthly trading low over the coming days. A bearish price pattern is warning of another $10.00 price decline.


