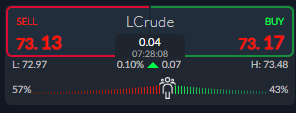
Crude oil is trading close to the best levels of 2021, following recent news that key OPEC minister failed to discuss July production hikes during this week’s meeting. Historically, the pushing back of production cuts have been a bullish catalyst for oil prices.
During OPEC’s Joint Technical Committee look past the subject of ongoing production cuts, leading oil traders to believe that OPEC ministers are nowhere near reversing ongoing production cuts.
The August meeting is expected to be a big one for oil traders are expecting a production increase. However, the increase is probably not going to be as large as feared, which is one reason why oil is rallying.
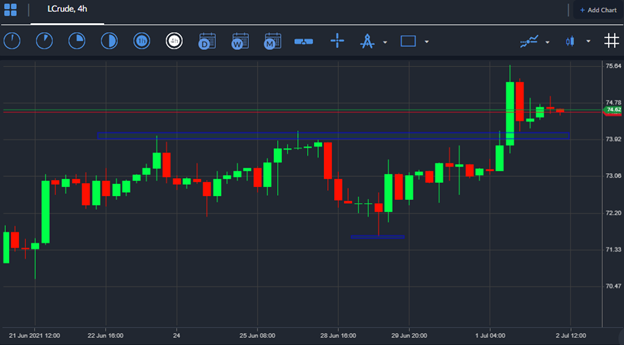
As long as OPEC continue to curtail supply and demand for oil remains reasonable we are likely to see ongoing push higher in oil prices continuing. Looking at the one-year price chart of crude oil a near perfect correlation exists between OPEC production cuts and higher prices.
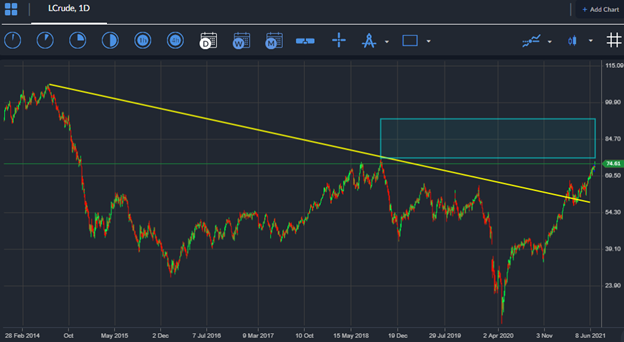
The weekly chart of crude oil also shows that crude oil is increasingly taking out key technical levels. Crude has cleared the 2020 trading high with relative ease, around $65.65, and has now breached a major falling trendline, which is taken by connecting the 2009 and 2014 highs.
Fears over to new COVID-19 variants is currently being pushed back as the energy sector is on a roll. Summer months are also seen as being better for consumption in the west as a clear correlation exists between better weather such as increased travel, and greater spending.
According to the ActiveTrader market sentiment tool some 57 percent of traders are bearish towards crude oil. Retail traders have once again been on the wrong side of the trading during recent push higher
If crowd sentiment remains at these current negative levels I suspect the current bullish trend in crude oil is likely to continue at a rapid pace. Sentiment may need to neutralize in order for any corrections to be sustainable.
Crude Oil short-term Technical Analysis
The lower time frames currently show that crude oil is forming an extremely large, inverted head and shoulders pattern. The pattern is activated while crude oil rallies through the $74.00 level.
According to the overall size of the bullish pattern crude oil could rally by as much as $3.00 if the $74.00 resistance level is breached. The $77.00 resistance level is seen as being a very likely target. The October 2018 trading higher, around the $76.60 level, also offers strong resistance.
See real-time quotes provided by our partner.
Crude Oil medium-term Technical Analysis
The weekly time frame shows that crude oil might be about to go parabolic after breaking above a key trendline that has been in play for over 5 years and has been in the making for over a decade.
Crude oil could also form a massive, inverted head and shoulders pattern if the $76.60 level is reached. It makes sense that we may see bulls testing between the $90.00 and $100.00 benchmark level while the price trades above the $76.60 level and the mentioned key trendline.
See real-time quotes provided by our partner.