The oil market has taken a hammering over the last twenty-four hours as technical sellers caused crude and Brent oil to fall by close to ten percent. News surrounding a steep rise in COVID-19 infections in Europe prompted the huge price slump.
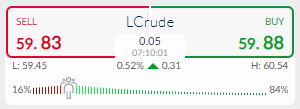
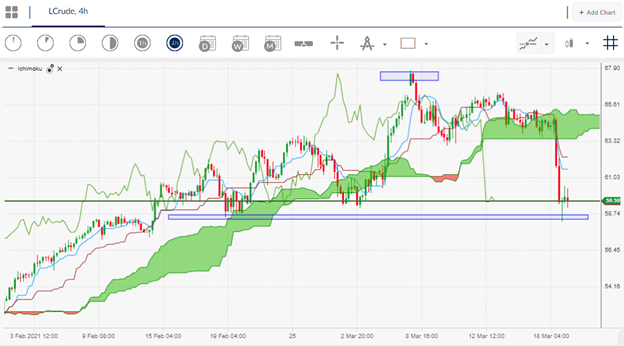
Crude oil has since bounced of the $58.00 support zone and is looking to reclaim the $60.00 handle once again. It should be noted that the oil market is still vulnerable to further downside as the bearish news surrounding new lockdowns in Europe continues to drop.
Other factors influencing the price of crude oil include a rising US dollar, which can reduce foreign demand, and a crude stockpile build up in the United States. Some vaccine companies are also having trouble meeting demand.
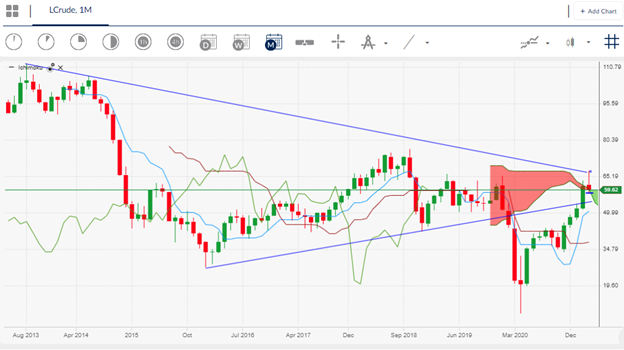
On the technical front, a huge monthly trendline was breached during yesterday’s price drop below the $63.00 level. Crude oil rallied by $5.00 once this key trendline was breached earlier this month, and in turn dropped by $5.00 when it was breached to the downside yesterday.
The market is certainly looking at this big trendline, which can be drawn on the monthly time frame by attaching the 2008 trading high, the all-time price high for crude, and the 2013 and 2014 trading highs, and is located at $63.00.
Going forward, bulls probably need to secure daily, weekly, and monthly price closes back above this trendline to secure the medium-term prospects for crude oil. Much will depend on the news surrounding the global economy and COVID-19 lockdown over the coming weeks.


