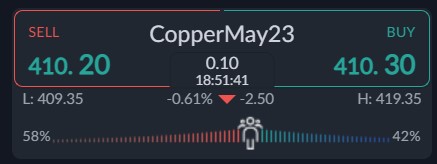
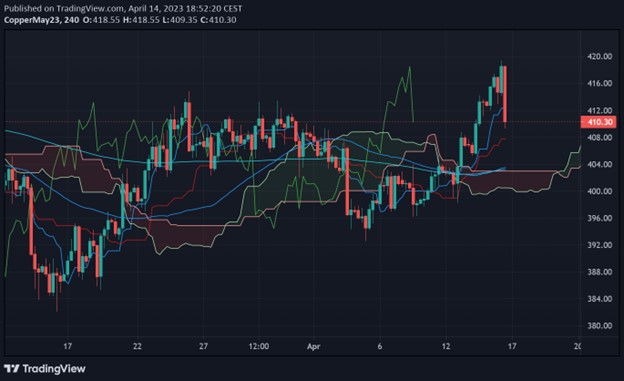
The price of copper has started to rise above the $400.00 level following recent mixed economic data from the world’s two largest economies, which are America and China.
Copper is a bellwether for the global economy. Poor economic growth normally means lower copper prices. The fact that gold and silver are rallying while copper is falling shows the concerns of the economy.
Data from China has recently been improving or better than expected which could soon help to move copper prices into a higher trading range, which is aligned with sentiment and the technicals.
However, the US economy is not that impressive and possibly we need to see the US economic data starting to improve before we start to see real traction above the $400.00 level.
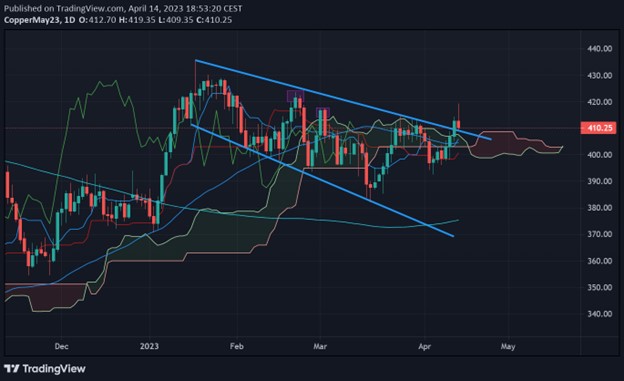
Earlier this year copper price surged towards the $440.00 level. This would be the benchmark for copper to take out in order for a breakout to happen.
Sentiment towards copper has been a big catalyst for copper prices. Sentiment towards copper is now quite bearish, with retail appearing to be caught on the wrong side of the trade recently, we need to careful of a sudden bounced in copper after the recent Chinese data.
According to the ActivTrader platform some 58 percent of traders are bearish. With the current sentiment bias towards copper, I believe more short-term upside in the red metal seems the most likely scenario.


