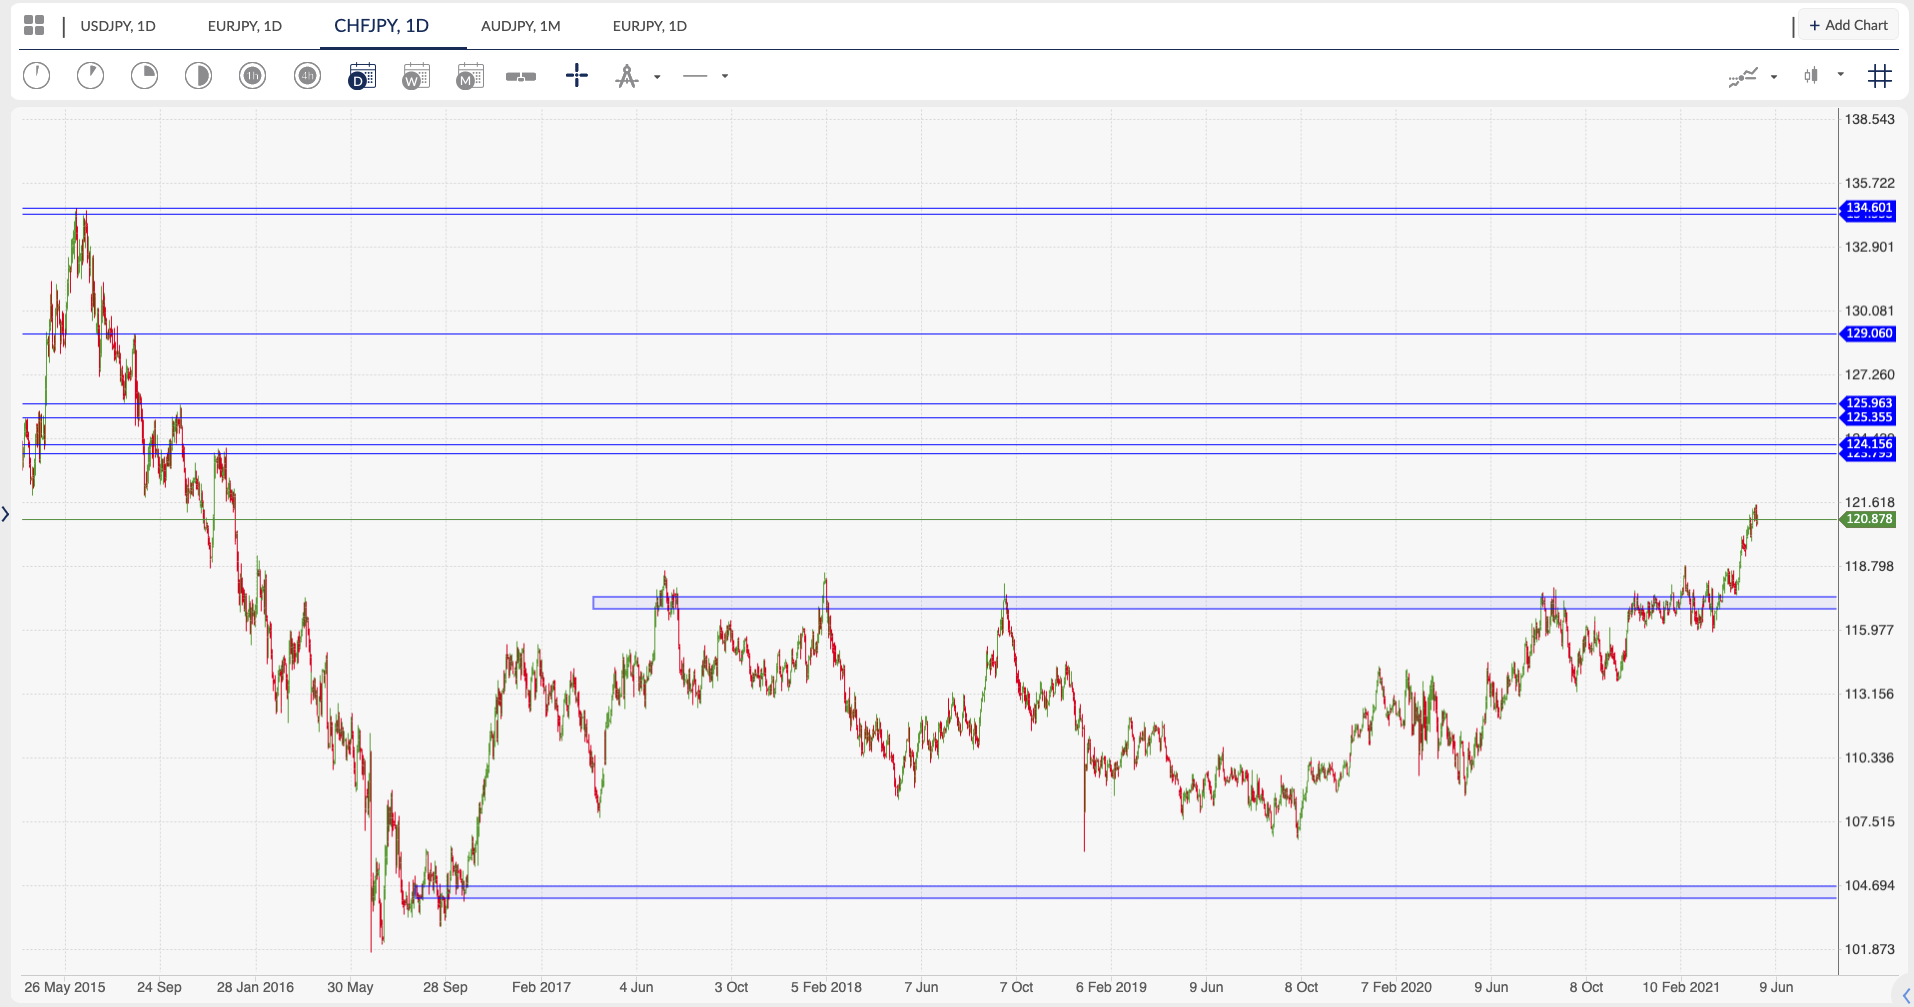
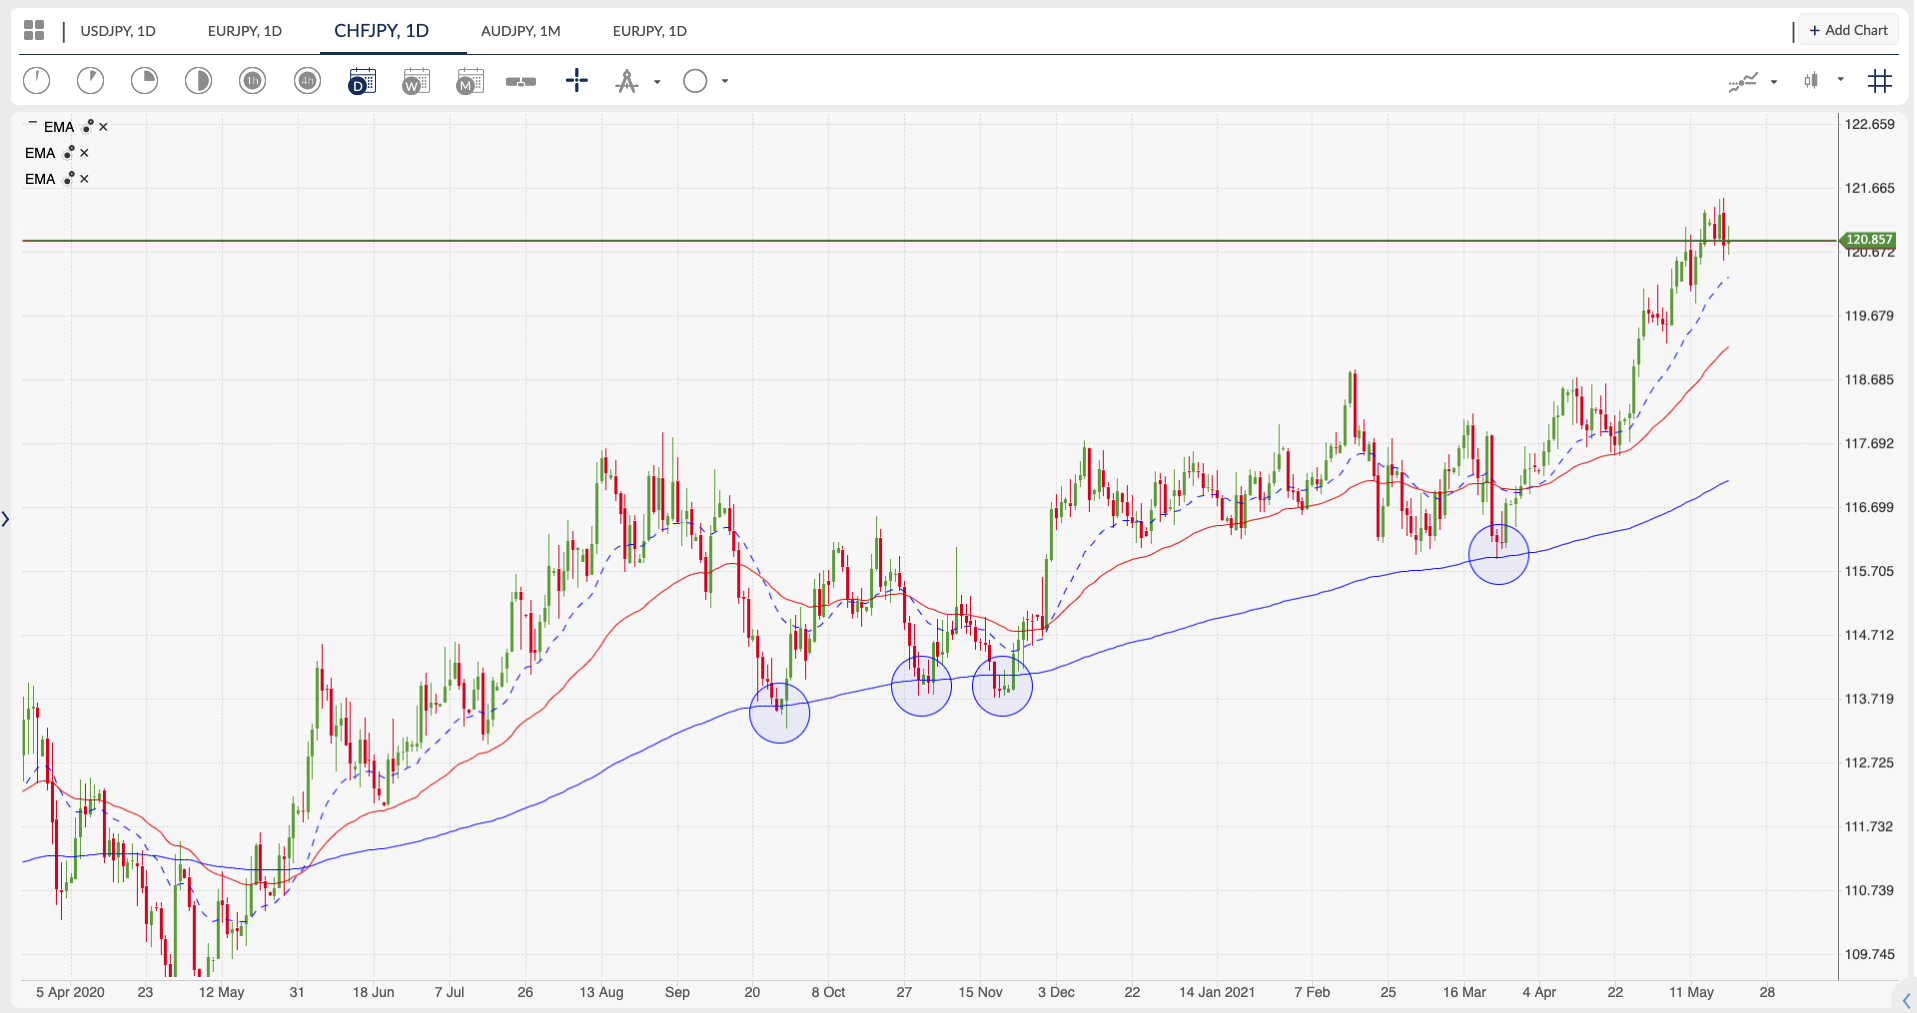
CHFJPY Analysis
It is essential to understand why client sentiment is regarded as a contrarian signal. The majority of retail traders trade against the dominant trend, they love to try and pick the top or catch the bottom of a move, but rarely are successful at doing so.
One of the first things traders will look at when they start trading is a price chart with some moving averages. They will explore what these indicators and candlestick patterns mean and during their initial research, they will come across the phrase, “The trend is your friend”. After a period of time, they will start to feel they have the measure of the market and for some reason, they will try and trade the turn in the trend and basically give up on just going with the directional flows.
Retail traders are liquidity providers. They are not George Soros or Warren Buffet, so have no way of moving a market as individuals, but the larger market participants will use retail trader order flow to facilitate their clients’ trades. When a retail trader goes short, some other trader is on the other side of that going long. When that retail trader’s stops get taken the market makers and institutional traders are generally the ones triggering them.
If the market is in an uptrend and retail sentiment is overwhelmingly short, all those traders fighting the trend will eventually need to close their positions or risk losing their equity. When they puke, they have to buy back their position to close out. The added buying from closing out the shorts accelerates the bullish move further higher, which is when the Institutional orders can sell into that flow.
The ActivTrader sentiment indicator is a good way to judge how retail traders are overall positioned. Today the traders on the platform are overwhelmingly long the Japanese yen and looking at the CHFJPY are extremely short the Swiss franc versus the yen. This is not to say that the majority of traders are short the franc against the rest of the currencies, but this particular CHFJPY pair is showing the extreme view some traders can take.
See real-time quotes provided by our partner.
Before we go to the monthly picture on the CHFJPY, I just want to highlight how weak the yen could be using some wave theory. Starting with the monthly chart of the EURJPY it is instantly obvious to see that momentum is to the upside, with 7 monthly consecutive green candles. Nothing goes up forever, but the trend for 2021 is obviously to the upside.
See real-time quotes provided by our partner.
In November/December 2020, the EURJPY broke out above a descending trend line, signalling the start of the move higher. But more importantly probably the end of a corrective move that started after the original impulsive move higher from 2012-2014. The ABC correction that ended on the breakout in late 2020 could have been in Elliot Wave terms as corrective 2nd wave, which would lead into an impulsive 3rd wave. If this were true, the 3rd wave is known generally to be the longest of the waves and is also on average 161.8% larger than the first wave. If EWT were to be the predictor of this move, wave 3 would be targeting the highs from 1990, so a massive move potentially.
See real-time quotes provided by our partner.
The picture for the CHFJPY on the monthly chart is not as potentially clear, as the two currencies generally benefit equally from safe-haven flows, so rarely move against each other directionally. However, after a clear consolidation period, the move out of the range is usually the real move, so when I see the CHFJPY move higher out of an area of balance, I tend to think it is going higher for longer. The obvious current monthly target would be the May 2015 highs.
See real-time quotes provided by our partner.
Coming back to more near-term price projections, if we assume that the majority of retail traders are wrong in shorting the Swiss franc against the Japanese yen, where may they have their stops? Currently, the nearest swing high and probably liquidity pool is around the 124.00 level, with more stops above the swing highs between 125.30 and 126.00 price levels. So at least 300 pips away. When the 96% or so traders who are on the wrong side of the breakout and bullish trend see price approaching their stops above 124.00 that is how price can accelerate to the 126.00 levels.
As I have previously stated, nothing goes up forever and it is unlikely we get a 500 pip move in the remainder of May. So for anyone looking to get involved in this bullish trend, where could the next entry signal come from?
See real-time quotes provided by our partner.
Looking at the moving averages on the daily time frame, the 20, 50 and 200 exponential averages have for the last year provided decent dynamic support zones. With the 200 ema being the most reliable of late. In the stronger parts of the move higher, the area between the 20 and 50 ema’s has been a place to look for a reversal candle higher, so a bullish daily engulfing candle bouncing off the 50 ema would have proven very lucrative this last year or so.
When not to trade that is if you see the 20 ema curling lower, showing that recent momentum is waning, which is usually after the price has reached a round number level or previous support which is acting as temporary resistance. For the more conservative and patient trader, waiting for a bounce off the 200 daily ema would give the best risk to reward profile.