Brent crude oil is moving closer to the $64.00 level, as the energy sector continues to enjoy strong tailwinds from the harsh winter in the United States. Recent news that the cold blast in the US caused 3.5 million barrels of crude oil to dwindle helped push oil price higher this week.
The oil market is trading up big so far this year, with WTI oil sporting gains of over twenty percent, and Brent crude trading around $14.00 above its 2021 opening price. The technicals surrounding Brent crude also look very favourable at the moment.
Not only is $70.00 close to $6.00 away from current trading levels, but a number of fairly reliable price patterns are suggesting that this major benchmark level is an achievable price target. Credit Suisse bank also agrees.
The bank states “Brent crude has broken out forcefully from its bull flag continuation pattern and has seen its expected break above the 78.6% retracement and February 2020 high, at $59.82/60.00 to expose the $71.75 high from last year”.
Credit Suisse also talked up the case for breaking even higher than $70.00. “Whilst a pullback from the $71.75 mark should be allowed for, a break can see next resistance at $79.10, which is the measured flag objective.”
Given the scale of the run higher I think it is prudent not to get too carried away with just the upside potential. I believe that the $60.00 to $59.50 area is likely to offer solid support on technical pullbacks. Credit Suisse analysts also discussed what may happen on a pullback from current levels.
They noted “Key support remains seen at $54.60/48, which if broken would negate the bull flag. However, this is not our base case”. I believe that $54.60/48 may be too low from current levels. A $10.00 pullback appears too severe without very negative news catalysts.
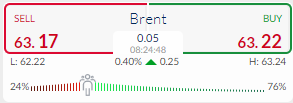
Market sentiment towards Brent Crude is bullish and approaching worryingly euphoric levels. The ActivTrader Market Sentiment tool shows that some 76 percent of traders are bullish towards further gains in Brent oil.


