The Australian dollar is struggling to continue its recent multi-month price advance against the US dollar after the April jobs report from the Australian economy provided a mixed picture of the current employment situation.
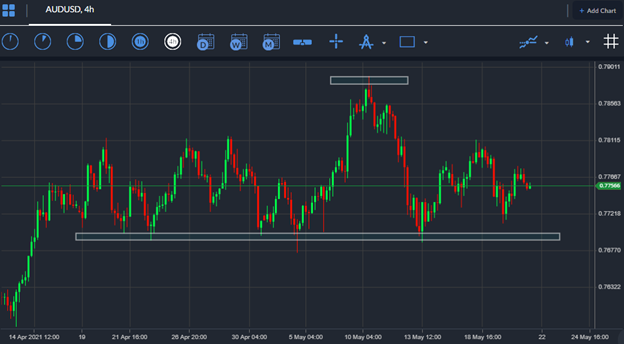
Bulls and bears have been battling around the 0.7700 to 0.7900 levels for much of the last four weeks. Worryingly for bulls the AUDUSD pair has not been rallying despite the price of iron ore picking up over recent days. Typically, the Australian dollar performs well when the iron ore prices post strong gains.
Digging into the Australian jobs report, the headline number came in much weaker than expected, with the Australian employment change moving to -30,600. This was a big miss on many fronts, and down heavily from the previous months number of +70,700.
On the positive front, the unemployment rate came in at its lowest since April 2020. Officially, the Australian unemployment rate fell to 5.5 percent, which was weaker than the 5.6 percent expected, and the 5.7 number seen last month.
A steep drop in the participation rate was seen as the reason why the unemployment rate dropped. This puts the Reserve Bank of Australia in a tough spot next month, meaning that they are more likely to keep low interest rate and their bond buying scheme in place, which could weigh on the AUDUSD pair.
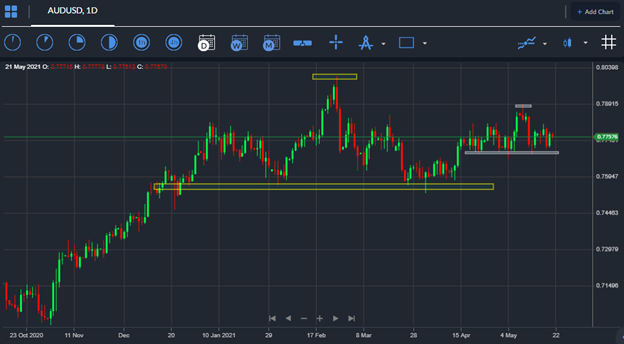
On the technical front a number of bearish head and shoulders patterns continue to loom over the AUDUSD pair. These patterns are littered across various time frames and provide some evidence that the Australian dollar could be about to decline.
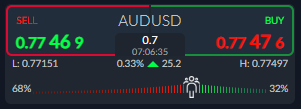
According to the ActivTrader market sentiment tool some 68 percent of traders are bearish towards the AUDUSD pair. Considering that the AUDUSD pair is in a bull market and we typically look to fade retail sentiment, it is probably a good time for the Aussie to rally right now.


