The Australian dollar is set for an extreme bout of trading volatility over the next twenty-four hours, as the Australian economy releases the fourth-quarter GDP report, RBA monthly bulletin, and the February jobs report.
Reserve Bank of Australia assistant Governor Kent is also set to speak on Thursday, while Australian retail sales numbers are due during the early hours of Friday morning. This raft of high-impacting data points is likely to set the tone for the Australian dollar this month.
Traders will be acutely aware that the Reserve Bank of Australia have a strong focus on inflation, jobs and consumption data, making this week’s data releases particularly noteworthy. Expectations for the upcoming jobs and retail sales report are tilted to the upside, due to the ongoing rise in commodity prices.
The AUDUSD pair has been coming under pressure lately and falling as the US dollar index rises. This is despite the outperformance of commodities such as iron ore and more positive tone from the RBA. Gold may also have a hand in the AUDUSD pair’s weakness.
Gold and the AUDUSD pair have a price correlation of close to 80 percent. Gold has been tumbling hard since mid-February, which has translated into weakness in the AUDUSD pair. Australia is rich in gold mines and has many gold miners, so the correlation is easy to draw.
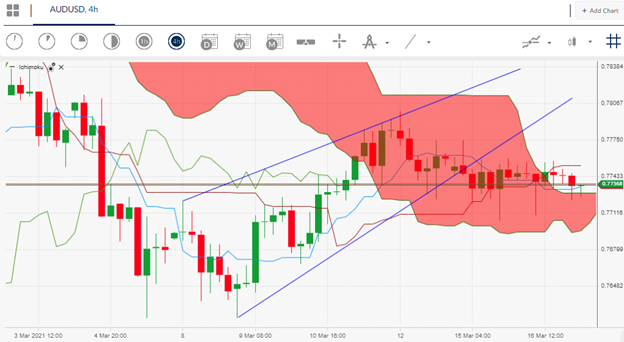
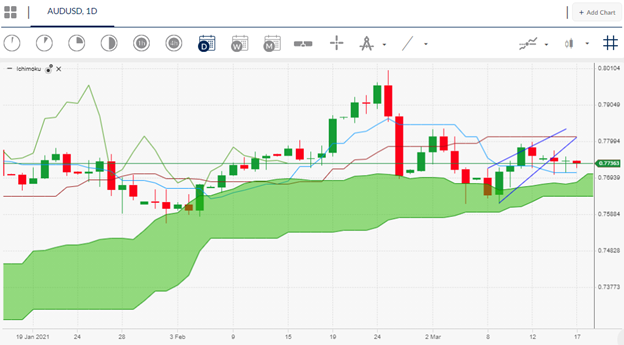
In terms of technicals, a number of bearish price patterns are engulfing the AUDUSD pair in both the short and the medium-term. The 0.7600 support level is the key levels that bulls need to defend this week to avoid a more protracted sell-off in the AUDUSD pair.
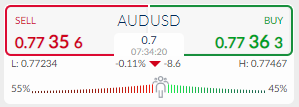
According to the ActivTrader market sentiment tool some 55 percent of traders are bearish towards the AUDUSD pair. Considering that the pair has seen a strong pullback and recovered somewhat, it is still not clear if bears are currently on the wrong side of the market.
The sentiment skew towards the AUDUSD pair is not too large at present and could suggest that range bound conditions between the 0.7600 to 0.7800 areas may remain in force.