Market Wrap
The Bureau of Economic Analysis published today a report showing personal spending in the US increased by 1.1% or $185 billion in March 2022 on a month-over-month basis. Personal income rose by $107.2 billion, or 0.5%, over February. On an annual basis, the PCE price index for March grew 6.6%, reflecting increases in both goods and services. During the same period, energy prices increased by 33.9% and food prices by 9.2%. The Core PCE price index increased by 5.2%.
As traders position themselves ahead of next month’s Federal Open Market Committee meeting, US Treasury yields rose again today, returning to near the 3% level after the Personal Consumption Expenditures (PCE) data announcement. Fed officials use the indicator to measure inflation and the recent reading may have reinforced expectations that the central bank will raise interest rates 50 basis points not only next month but also in June, as part of its effort to restore price stability.
See real-time quotes provided by our partner.
The University of Michigan Consumer Sentiment Index rose 9.8% on a monthly basis to 65.2 points in April, according to the final report published today. Compared with the preliminary estimate, the index plummeted 26.2% year-over-year. Major US indices had already declined after inflation data earlier and continued to do so after the close in London with acceleration after the final economic data release out of the US. The Nasdaq reversed its pre-market gains to end the London session around -2.85% lower than the days open, with the S&P500 and Dow Jones Industrial Average dropping -2.18% & -1.56% respectively.
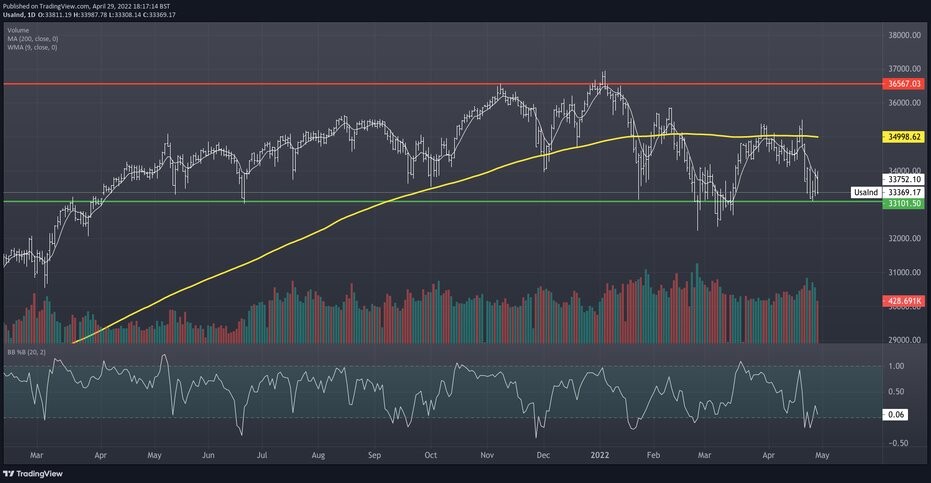
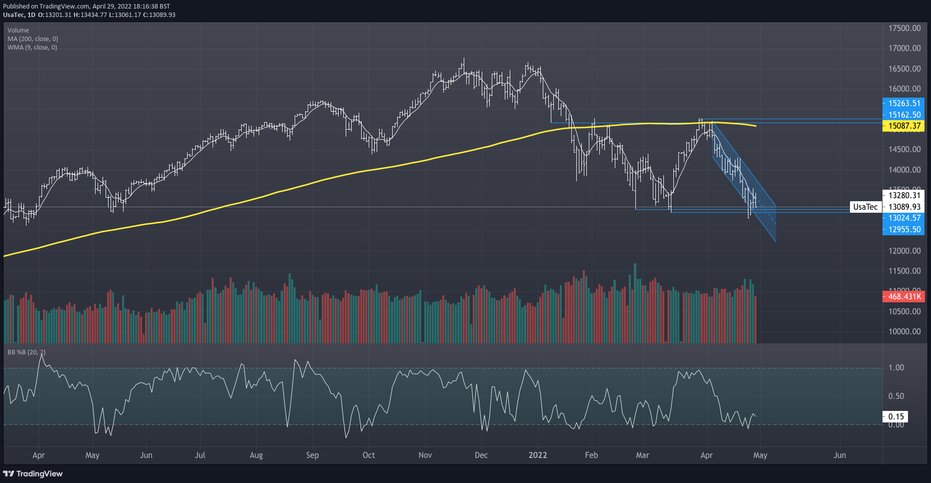
Both the DJIA and Nasdaq are at support levels but have been trading under their 200-period average for quite some time, indicating that the buyers are having a difficult time ahead of the rate hike in May and that we should now prepare for a possible further decline in May. Just as the saying goes, “Sell in May and go away”.
The forex heatmap has become clearer for direction in the US session with the commodity pairs doing relatively worse than the safe havens. Though the US dollar is mixed.
See real-time quotes provided by our partner.
There was some profit taking after the close above the resistance line marked on the EURUSD intraday chart. The price action is now back above that resistance line, and we should be expecting a move away from this accumulation zone, with a return towards the daily 200-ema possible.
See real-time quotes provided by our partner.
If the EURUSD should go higher, this will act as a drag on the US dollar index and the $104 could be significant high for the foreseeable future. The impulsive move higher culminated in a climactic top, in terms of price and volume. So that could have been traders initiating profit taking ahead of the Fed too.
See real-time quotes provided by our partner.
Brent is currently in a relatively symmetrical triangle chart pattern and is testing the higher sloping trend line for the 3rd time. Traders are worried about supply, just as much as they have been about demand and the drop in the US dollar could make it easier for energy to pop out of this corrective pattern.
The USDCAD is also in a corrective range though is hinting that it could break higher as descending channels usually break to the upside. Canadian GDP data today came in better than expected at 1.1%.