Natural Gas Commodity Analysis


Over the last 12-18 months there has been a lot of talk around the price of Oil, the reflation trade and the supply or demand of energy, but I feel that Natural Gas is generally ignored by retail traders. Looking at the comparison of returns for Natural Gas versus Brent or WTI crude, the trading of the black gold has been smoother but the returns for the Gas has been far greater. In the last 12 months Natural Gas has risen over 120% and would appear to be trying for even further gains. Whereas oil is starting to look like it may be rolling over and heading for some price discovery and value.
Trader sentiment on the ActivTrader platform shows that the oil traders are extremely bullish the current oil contract with 85% of them long. Whereas the Nat Gas traders are 63% long. I generally favour going against the majority and if I were to trade Oil and Gas I would be very tempted to keep going long Nat Gas and short Oil as a pairs trade.
See real-time quotes provided by our partner.
On the weekly chart for Natural Gas it would appear that only last week’s highs are currently indicative of where current resistance lays, and if the price of Nat Gas were to get above the 4.162 there would be blue skies above and rising support starting from around 3.00-3.30 with a balance area from June into July covering the 3.50-3.80 zone.
See real-time quotes provided by our partner.
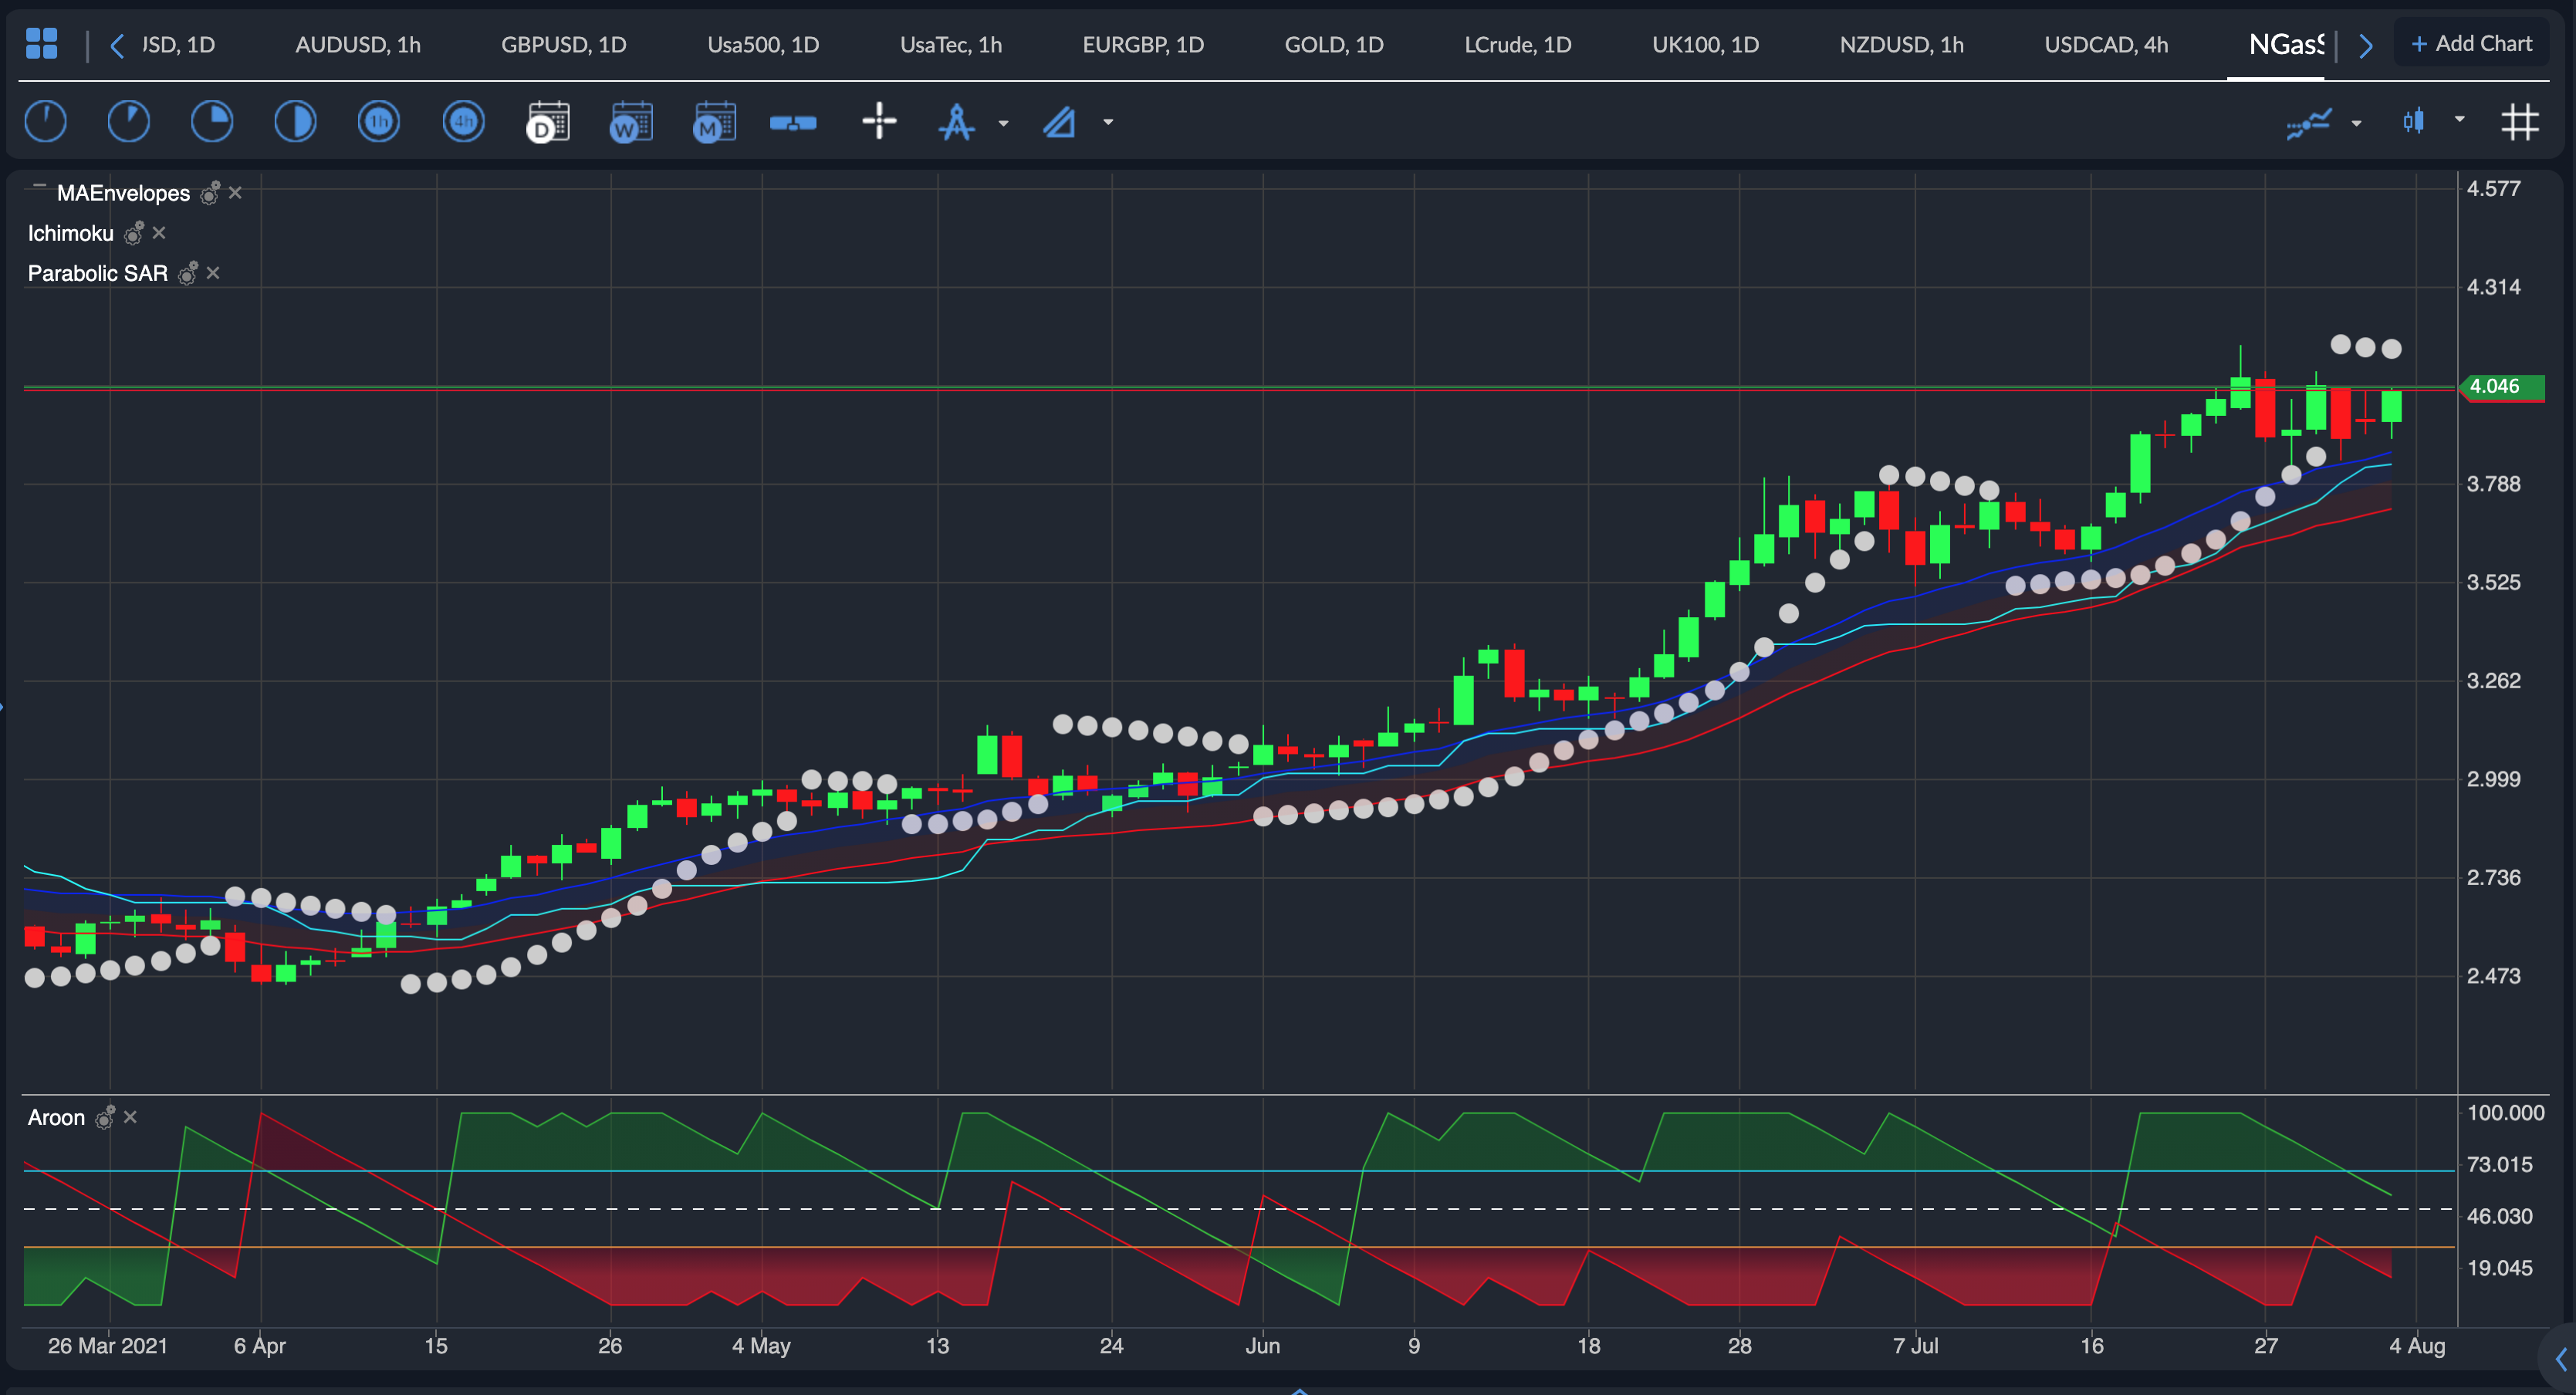
On a daily chart I am waiting to see if the price action can pop the Parabolic Stop & Reverse indicator (PSAR) to signal the next break out long. Using a couple of trend-based indicators such as the Ichimoku Kijun Sen, PSAR and Aroon has been a great way to follow along with the long entries. Obviously if you are in line with the higher time frame direction. However, you choose to find your entry signal, going with the trend and higher time frames direction is key.
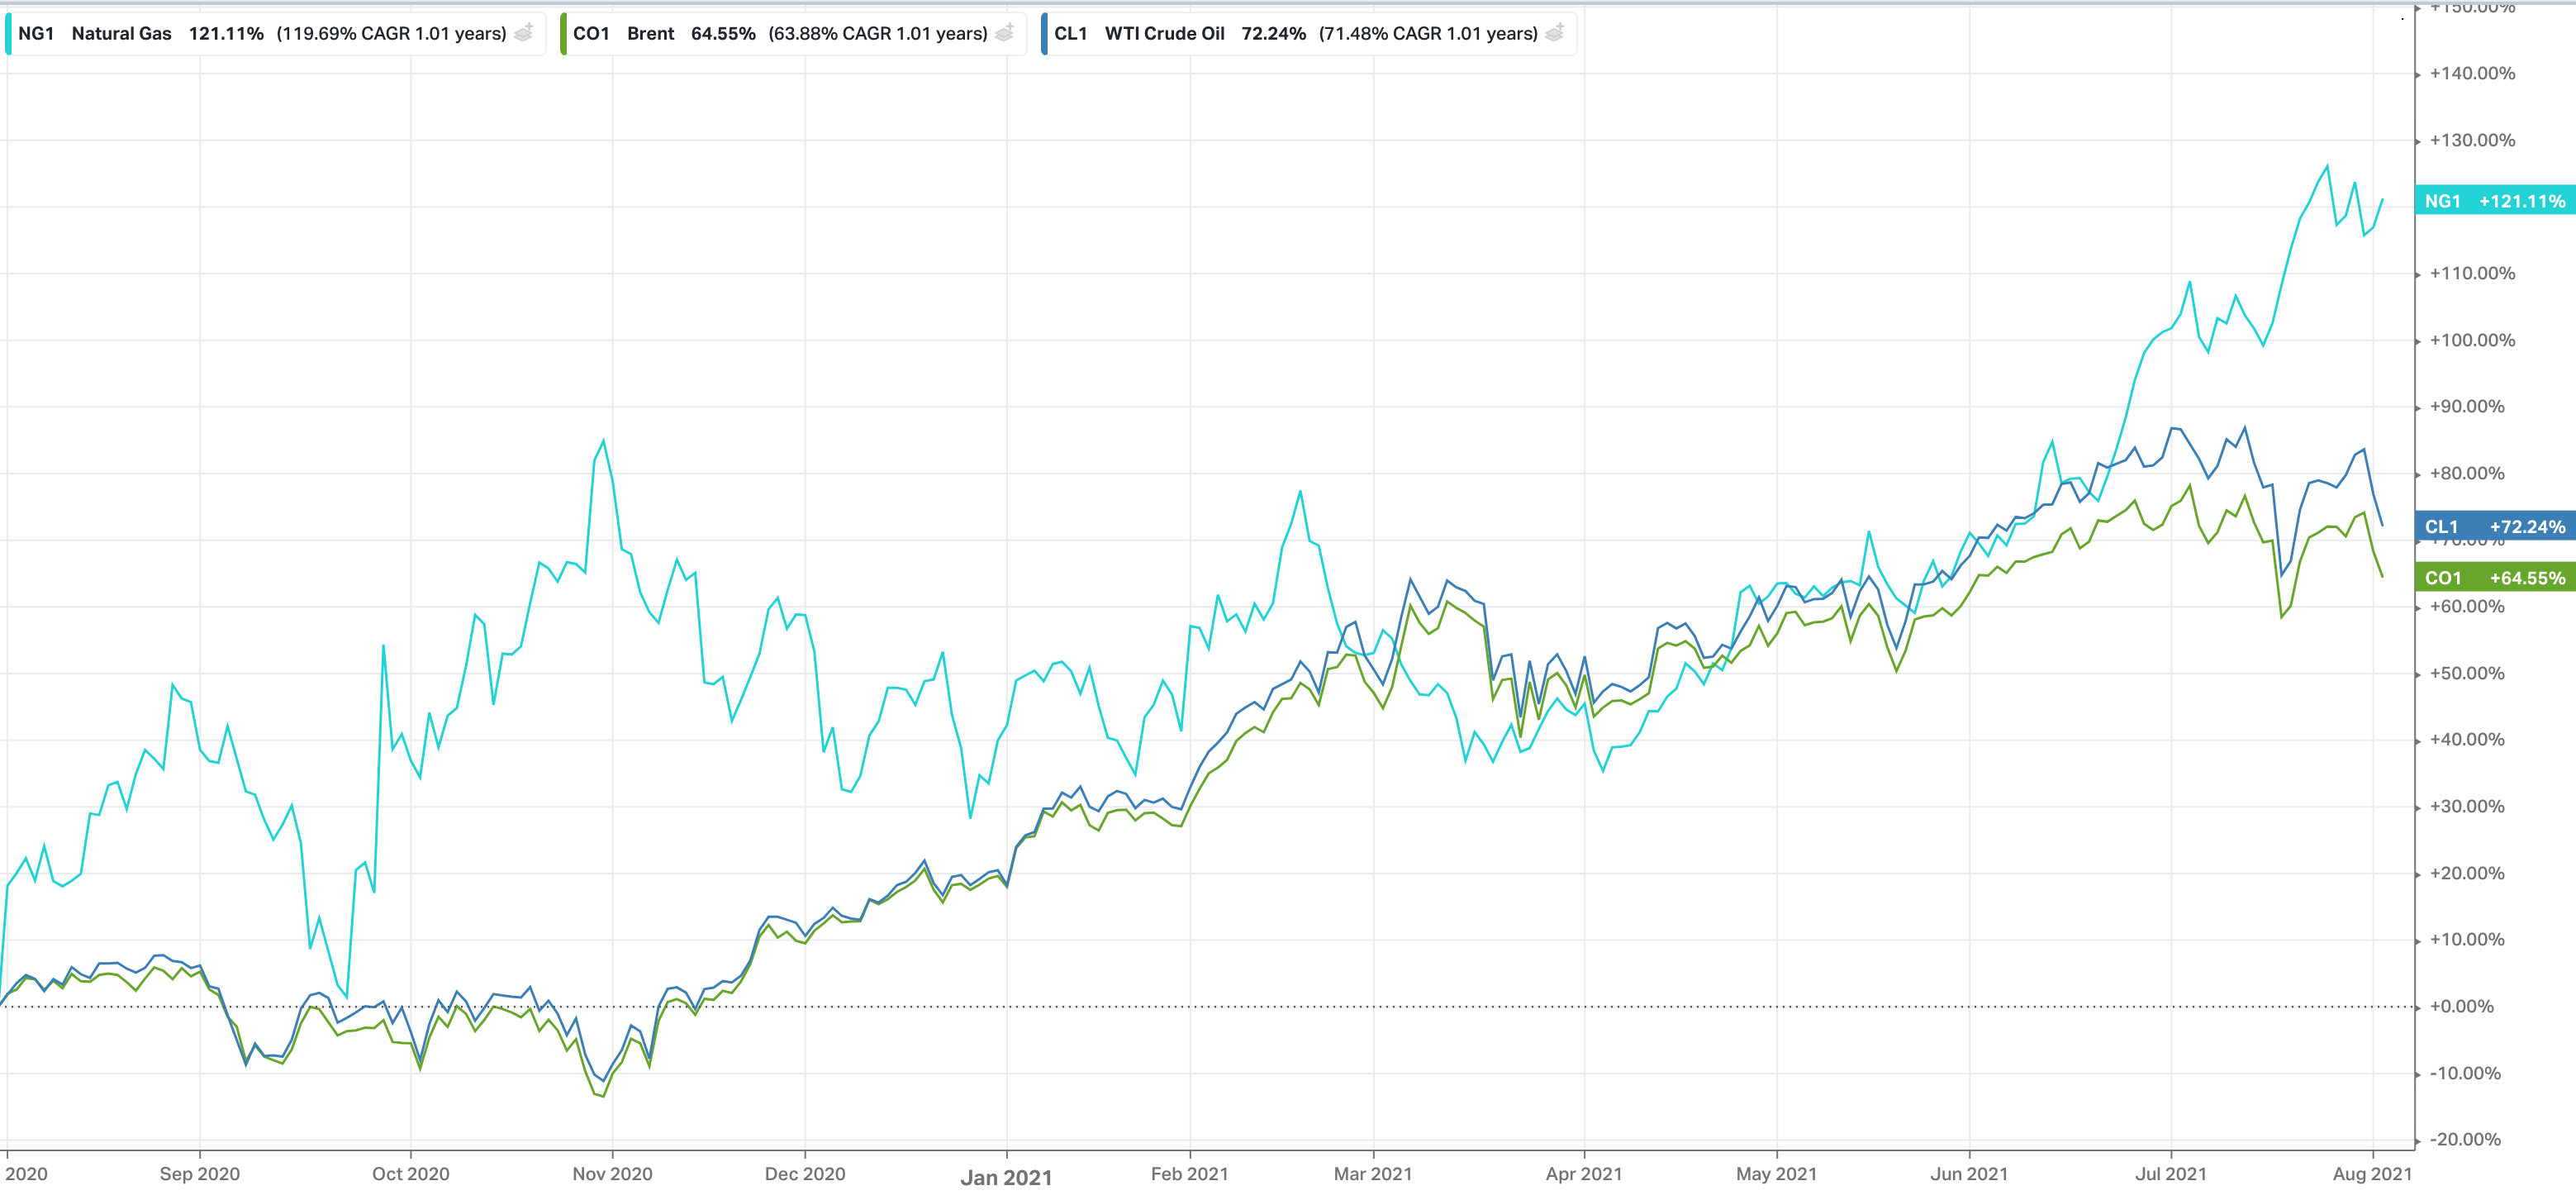
The other factor to consider is the fundamental reason why the price of Nat Gas is rising. A lot of the demand is for energy purposes but these days where you get your energy from, and how it is produced with regards to the environmental impact is just as important. A lot of the current demand for clean energy is to do with the idea of being net zero Carbon, minimising global pollution by 2050. With some governments trying to get to net zero by 2030.
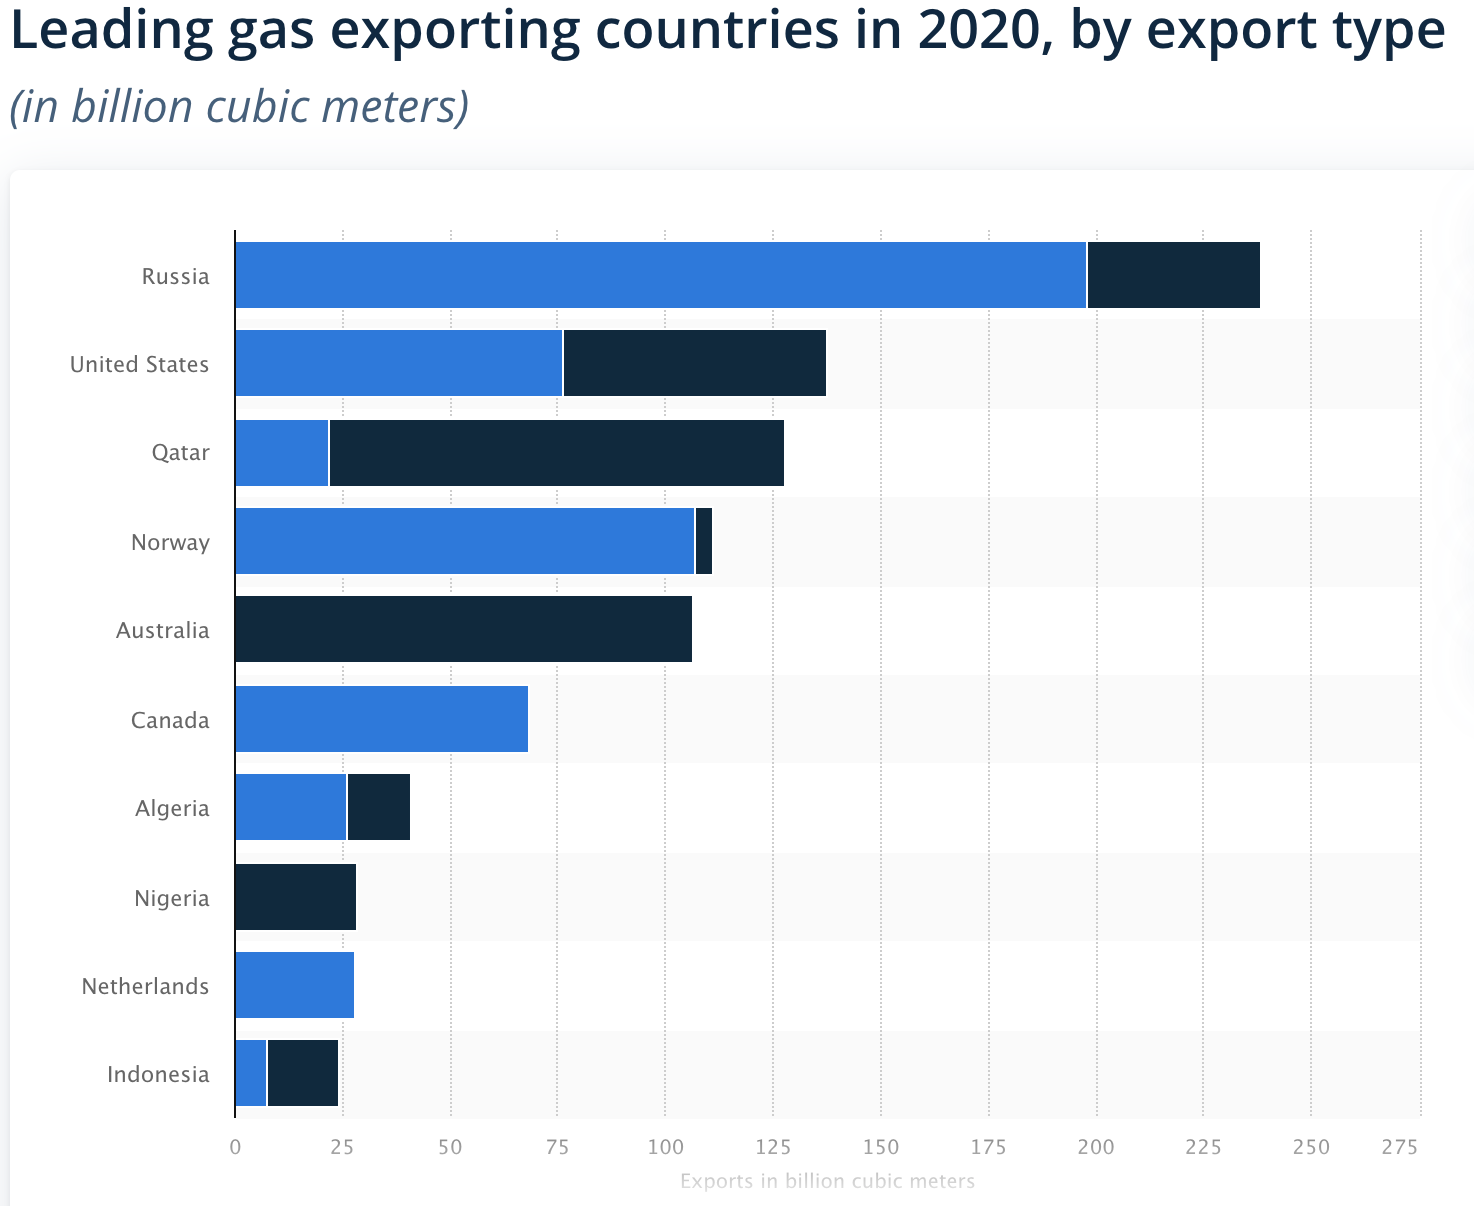
Clean, American-produced natural gas can meet the growing energy demand, with production within the USD being done so under the most rigorous environmental standards. According to the International Energy Agency’s methane tracker, the U.S. has among the lowest methane emission intensity of all-natural gas and oil producing nations.
A greenhouse gas is a gas that absorbs and emits radiant energy within the thermal infrared range, causing the greenhouse effect. The primary greenhouse gases in Earth’s atmosphere are water vapor (H2O), carbon dioxide (CO2), methane (CH4), nitrous oxide (N2O), and ozone (O3). Without greenhouse gases, the average temperature of Earth’s surface would be about −18 °C rather than the present average of 15 °C.
From the IEA:
Methane emissions are the second largest cause of global warming. While methane tends to receive less attention than carbon dioxide (CO2), reducing methane emissions will be critical for avoiding the worst effects of climate change. The energy sector – including oil, natural gas, coal and bioenergy – is one of the largest sources of methane emissions.


Clean energy from the USA is helping mitigate the supply issues from Russia into Europe.
Futures gas prices for 2021 in Europe have reached higher levels as Russia tightens supply. Russia wants EU authorities to approve the dual-pipeline Nord Stream 2 project through the Baltic Sea and into Germany. Russian exports to the EU via Nord Stream 1, Yamal and Ukraine to Slovakia have dropped by 26.5 billion cu m in the two storage years from April 2019. Ukraine has been a political hot potato recently as it moves towards the EU and away from Russia politically. Though the Kremlin is keen to make sure the full transition towards Brussels doesn’t happen. For now, Ukraine is a transit country for gas from Russia, but it doesn’t necessarily buy gas from Russia.
The price of Nat Gas is likely to keep rising this year as traders need to hedge against price spikes should we get a cold snap like the one a couple of years ago that was given the moniker ‘Beast from the East’, but also should there be an ever-tighter supply from world’s leading exporter of gas. However, Natural Gas prices have been a lot higher in the past, especially on the run up in 2008. Since then, the USA has developed shale gas fields and have been able to bring the prices of energy down by 40% so there is a lot more room to the upside, but ever higher prices would encourage more USA exports which would then put a cap on prices.
If traders are looking for a way to diversify into the energy markets without investing in a single commodity or company an ETF is a great play.
See real-time quotes provided by our partner.
The Energy Select Sector SPDR ETF, XLE, recently found support at the daily 200 exponential moving average and has been compressing under the $50.00 level for a couple of weeks.
With the move higher in Nat Gas and the relatively strong prices in WTI, energy company prices have been holding up these past 6 months. The XLE constituents include Exxon Mobil Corp., Chevron Corp, ConocoPhillips and 22 other energy firms. Exxon Mobil and Chevron recently had better than expected profits with revenues doubling. Looking at the daily chart it is conceivable to think that with the record profits and rising energy demand as economies re-open, the breakout to the upside of the 6-month range is possibly originating from these current levels. If there were to be a break down instead, any investment long would be mitigated with a break of the recent lows as that has now formed a support level.