The UK 100 is attempting to recover higher in the final trading day of the week, after previously coming under heavy downside pressure due to fears surrounding the third wave of the COVID-19 pandemic in Europe.
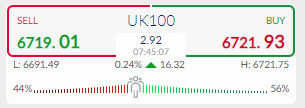
Rising global equity markets are giving the FTSE100 a boost back above the 6,700 level, after the leading UK index dipped towards the 6,600-support level earlier this week. Positive data from the US and the UK economy Thursday has helped to boost market sentiment.
Miners and oil companies inside the FTSE100 are leading the charge, as the solid data from the US and UK economies helped to lift commodity prices. The notion that the so-called commodity “super cycle” is still on track is being underpinned by the solid manufacturing data across the globe on Thursday.
Data released on Thursday also revealed that UK companies are increasing spending this month, in preparation for the end of lockdown in April. The spending is reportedly bringing the UK economy back into growth after being on the brink of recession this year.
Stock traders also cheered news that the UK unemployment rate dropped in the first three months through to January, and the UK manufacturing PMI far outpaced market expectation with a 56.6 reading in March.
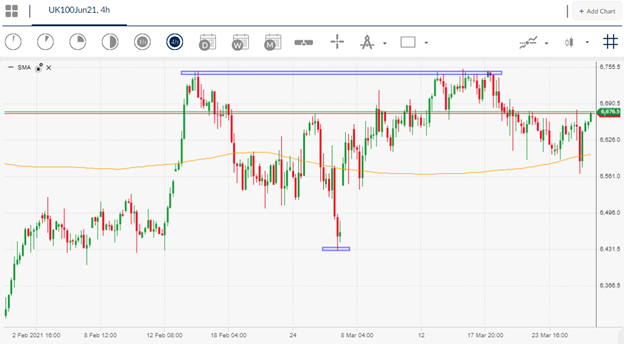
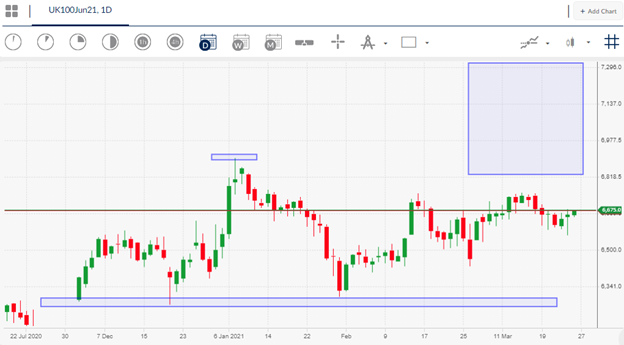
In terms of current technicals, FTSE100 bulls now need to break above the January trading high to cement the next major breakout, and finally send the index above the psychological 7,000 resistance barrier.
FTSE100 Sentiment Analysis
The Market Sentiment indicator on the ActivTrader platform currently shows that some 56 percent of traders are bullish towards the FTSE100 right now. Bulls have been decreasing, as sentiment was over 80 percent positive around two-weeks ago.
In order for the index to start to push higher, and take out the January trading high, we probably need to see sentiment towards the index turning heavily negative, as retail traders are typically on the wrong side of the trade.


