Gold came under heavy selling pressure yesterday, and is still under pressure, following a rise in the US dollar index as traders started to bet that the United States economy was beginning to grow better than other developed economies.
US Treasury yields exploded to the upside, providing a clear sign that financial markets are starting to grow more bullish towards a coming economic recovery. The US 10-year yield broke above the January 2021 high, of 1.2 percent, while the 30-year yield moved above the benchmark 2.0 percent level.
Traders are starting to sell gold and move into the greenback, as they believe that the Federal Reserve will need to raise interest rates soon-than-expected. Commodity-related currencies also bore the brunt of the selling.
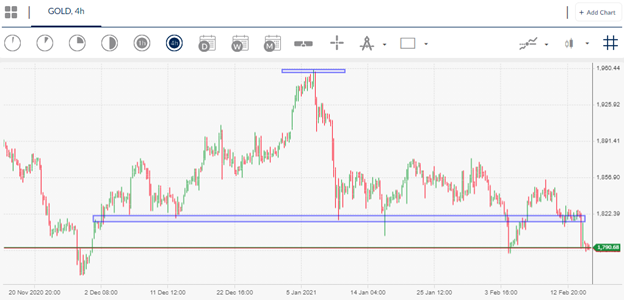
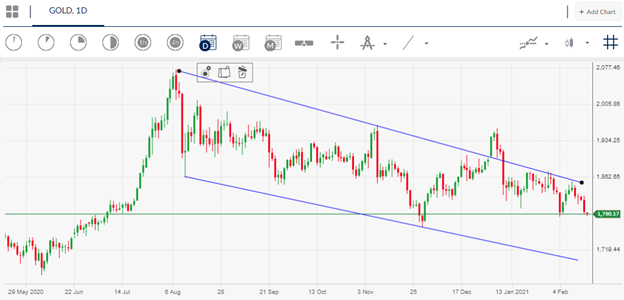
Gold had been lingering without much direction between the $1,820 to $1,850 price range over recent weeks before yesterday’s breakdown took place. From a price action perspective, the yellow metal looked ripe for a correction after failing to break above a key trendline resistance last week.
Technical traders are now keeping a close eye on the $1,800 level as this is the big support area which has been provoking bounces for much of 2021 when gold has appeared vulnerable to selling pressure.
Going forward, weakness below the $1,800 level will be a big red flag signalling that bears intend to take gold prices much lower. The downside could really accelerate if this scenario does happen as gold has been consolidating for an extended period of time.
It must also be noted that while Bitcoin and other cryptos have been rallying sharply over recent months gold has remained extremely muted from a price perspective. This new phenomenon is happening at time when Bitcoin hit a new all-time high of $50,000 yesterday.
Should this dynamic continue then gold be in for a nasty period of technical selling towards the $1,710 and possible the $1,600 area over the coming weeks. Seasonality is also not on gold’s side at the moment.
Gold Sentiment Analysis
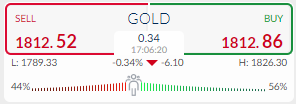
Market sentiment data on the ActivTrader platform currently shows that some 44 percent of traders are bearish towards gold right now, and 56 percent of traders are bullish towards the yellow metal.
This is not a concerning bullish skew at the moment, however, if traders turn more bullish towards gold and the price continues to fall then we should expect a powerful bearish short-term trend to form.


