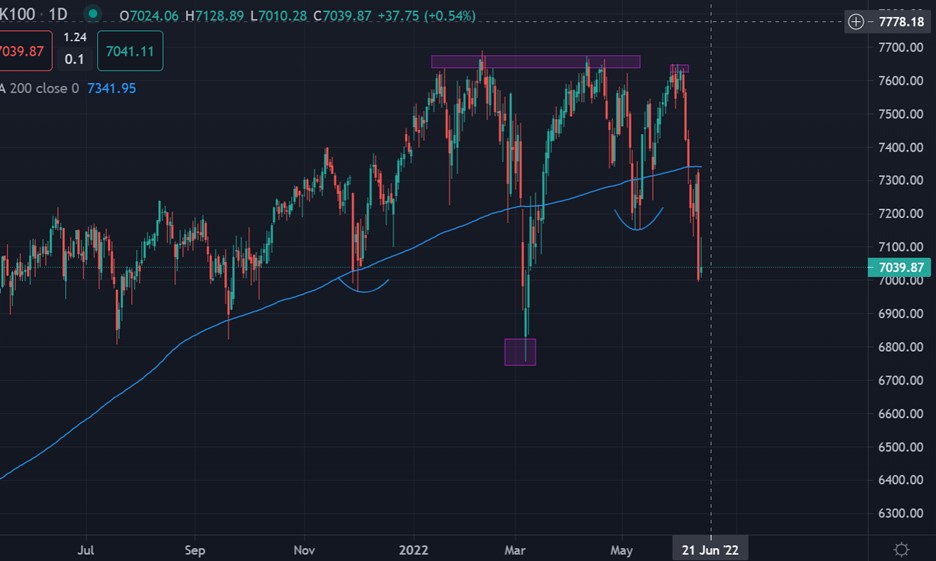
The FTSE100 crashed towards the 7,000-level last week, wiping out all the recent price gains in the leading UK index after the Bank of England implemented a fifth consecutive hike to interest rates as it looks to rein in soaring inflation.
Other factors were also at work behind the crash in UK stocks. Fears of a looming financial crisis and significant downturn in the global economy caused other stock indices to crash globally.
Inflation is surging worldwide due to spiking costs of food and energy, which have been exacerbated by the war in Ukraine and supply fears in agricultural commodities. Supply chain disruptions and demand shifts as a result of the pandemic have also driven up tradable goods prices.
The UK faces further economic hardship which is likely to pressure the FTSE100. The UK central bank need to bring consumer prices back under control against a backdrop of slowing growth and a rapidly depreciating currency, while the UK faces a major cost of living crisis.
Data last week showed that annually in April as food and energy prices spiralled. The Bank now expects inflation to rise to above 11% in October, reflecting higher projected household energy prices following an expected further increase to the UK energy price cap.
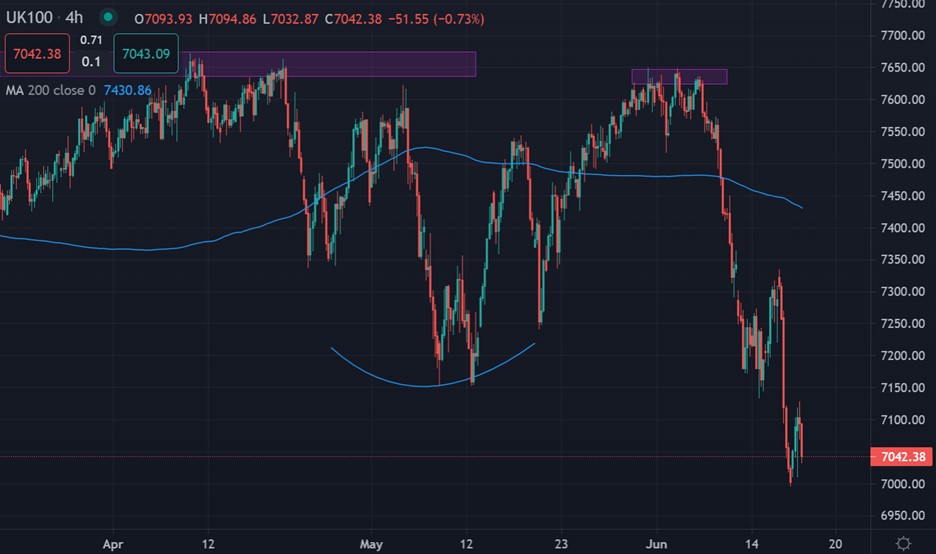
With this in mind the UK economy could be in for a very bumpy patch, and as such this is likely to cause more weakness. The technical picture looks bleak at present in the short-term.
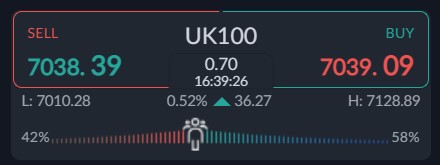
Sentiment towards the UK100 is also bullish right now. According to the ActivTrader platform only 58 percent of traders are bullish towards the UK100. This is not a great sign for bulls.
Typically, the retail crowd is on the wrong side of the trade more often than not, so the UK100 could continue to drop, as the charts in the technical analysis section below certainly suggest.


