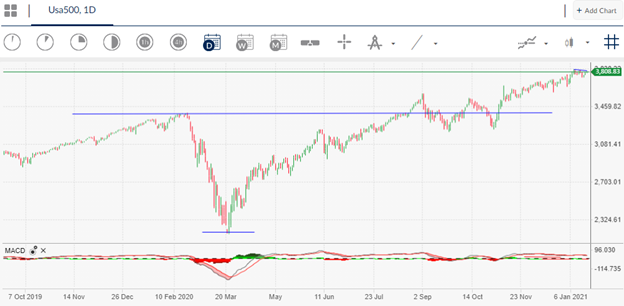
The S&P500 has rebounded back towards the 3,800 level, following last Friday’s heavy down move in US equity markets. A firmer risk tone in markets and positive risk sentiment over incoming US Treasury Secretary Janet Yellen’s policy stance has helped to cement the notion that the Biden administration will attempt to aggressively kick-start the United States economy with stimulus.
Looking at the technical picture for the S&P500, the index has started to stall around the highs of the month. The reason being that a bullish reversal pattern on the lower time frame has reached its overall bullish target.
With this in mind, the S&P500 probably needs a new technical or fundamental catalyst at this juncture to continue making new highs. The long-term technical picture for the S&P500 looks superb over the long-term while the index trades above the 3,300 level.
Lower time frame analysis does show notable negative MACD price divergence. This could mean that the index could correct lower if bulls fail to sustain the ongoing rally above the 3,800-resistance level.
Long-term analysis suggests that the index could be headed towards the 4,500 level. This may seem a distance target, however, it is imminently achievable if bulls can gain traction above the 4,000 level.
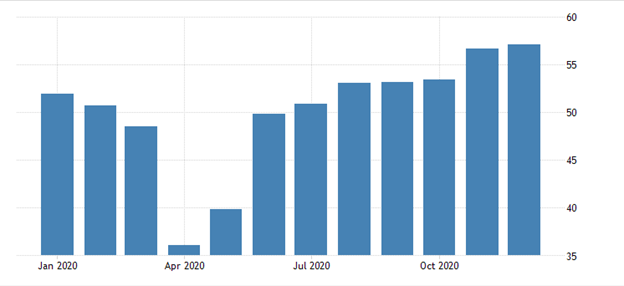
In terms of what could post-pone more upside in the S&P500, I suspect more weak United States data and rising fears of US inflation could cap cause a notable correction in most of the leading US indices.
Market participants are currently watching inflationary pressure in the US closely, meaning that the market could easily sell-off if they fear that the Federal Reserve may need to raise rates sooner than expected to tame inflation.
![](https://youtrading.com/en/wp-content/uploads/2021/01/chart-2-8.png)
This week’s US January Manufacturing PMI release will be a key test for the S&P500. Rather than the headline number inside the PMI report, the prices paid component inside the report will be key for traders and investors.
Last month, the US PMI report showed that prices paid for numerous items started to increase. Due to poor weather and rising commodity prices paid could be considerable higher this month. This could certainly be a reason for another market sell-off.
S&P 500 Short-term Technical Analysis
The four-hour time frame clearly shows an invalidated bearish head and shoulders pattern has reached its upside target around the 3,800 level, meaning that near-term bullish technical catalysts are in short supply.
![](https://youtrading.com/en/wp-content/uploads/2021/01/Usa500-4h.png)
Source by ActivTrader.
The mentioned time frame also shows notable amounts of negative MACD price divergence extending down to the 3,550 area. Watch out for a sudden reversal if bulls fail to gain traction above 3,800 and take-out the 3,680-support level.
S&P 500 Medium-term Technical Analysis
The key feature on the daily time frame is the extremely large, inverted head and shoulders pattern that continues to play out to the upside. The overall target of the pattern is located around the 4,500 level.
This large price pattern could be the reason why traders are so confident to buy the dips in the index, as they fully expect it to reach its overall price target.
![](https://youtrading.com/en/wp-content/uploads/2021/01/Usa500-1d-1.png)
Source by ActivTrader.
Traders looking for a negative technical sign in the near-term should watch out for daily price closes below the 6,747 level as a bearish signal. Dip-buyers could be primed to enter a pullback towards the 6,600 to 6,500 area.