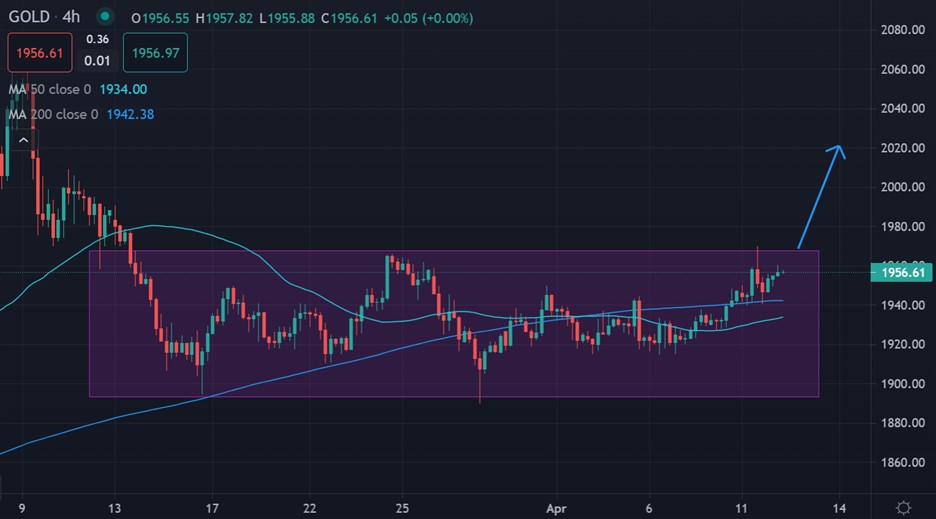
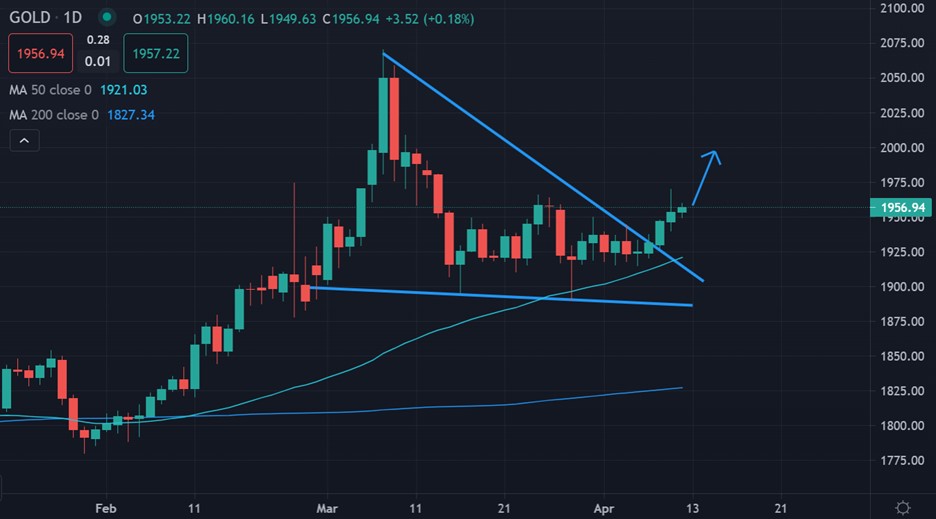
Precious metals rose sharply on Monday, whole gold hit a four-week trading high as some early signs emerged that the yellow metal made a significant price bottom recent around the $1,900 support level.
Metals are basically seeing some safe-haven demand on worries about inflation becoming even more problematic in the coming months some profit taking by the shorter-term futures traders, and amid rising bond yields and a selloff in the crude oil market added to the risk-off sentiment.
The Russia-Ukraine war is in its seventh week amid no signs of any ceasefire adding to the negative sentiment. The Covid pandemic continues to surge in China, which has once again clouded the growth outlook for the world’s second-largest economy.
Inflation worries are also near the front burner of the marketplace, which could be bullish for gold. The U.S. data point of the week comes Tuesday with the consumer price index report for March, which is expected to come in hot at up 8.4%, year-on-year.
It’s likely to be a short and volatile trading week as U.S. and other world markets are closed on Friday for the Good Friday holiday. However, if we see a double-digit inflation report, gold is trading above $2,000 by the end of the week.
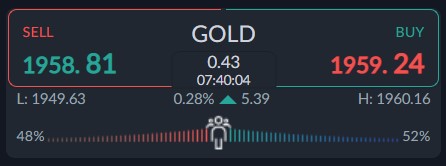
Current sentiment metrics towards gold show that traders are becoming less bearish, which is not a good sign. The ActivTrader market sentiment tool shows that 48 percent of traders are bearish towards gold.
While this is a minor sentiment bias, it is mildly bearish for gold price that after retail has, in the majority, remained long towards gold during the bulk of the run-up towards $1,950.


