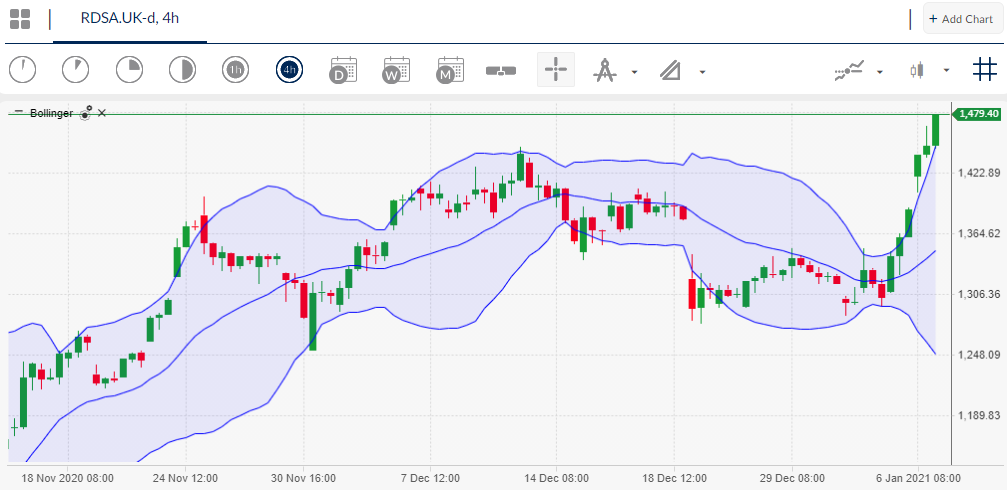
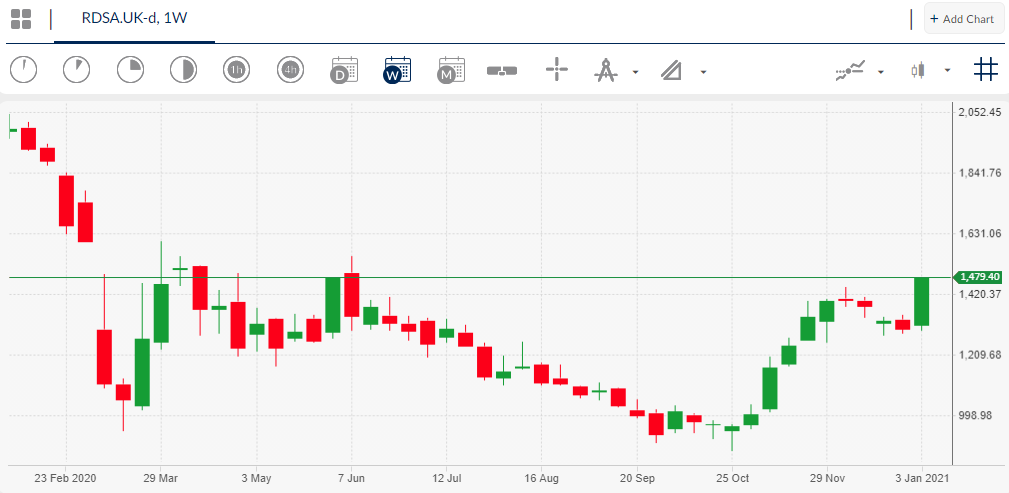
The FTSE100 surged to its highest trading level trading level since the March 2020 market crash, as oil giants BP and Royal Dutch Shell lifted the leading UK index over 200 points higher from its daily opening price on Wednesday.
News that Saudi Arabia will be imposing output cuts sent the value of Brent Crude Oil over 5 percent, and lifted oil companies inside the FTSE100. It should be noted that over half of the currently weekly gain in the UK100 come from BP and Royal Dutch Shell, hence the index is not as strong as it appears.
Fears over COVID-19 infections, and the newly imposed UK lockdown, probably until at least March this year, has naturally soured the mood for a number of key stocks inside the FTSE100. Downbeat service PMI data from the United Kingdom also did little to help hospitality and retail sector stocks.
Furthermore, bad vibes are coming from the US stock market at the moment, following the heavily negative ADP private sector jobs report, and concerns about fiscal spending after the Democrat party gained control of the US senate.
One could speculate that traders may see more value in UK companies at the moment, due to the fact that some US companies are overvalued, and the with the current unstable US political situation, some of the top companies may appear more expensive.
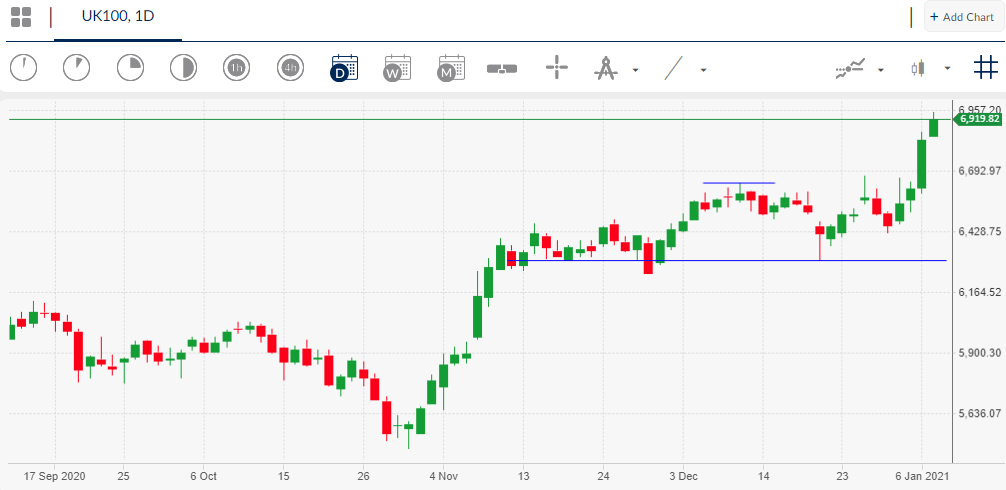
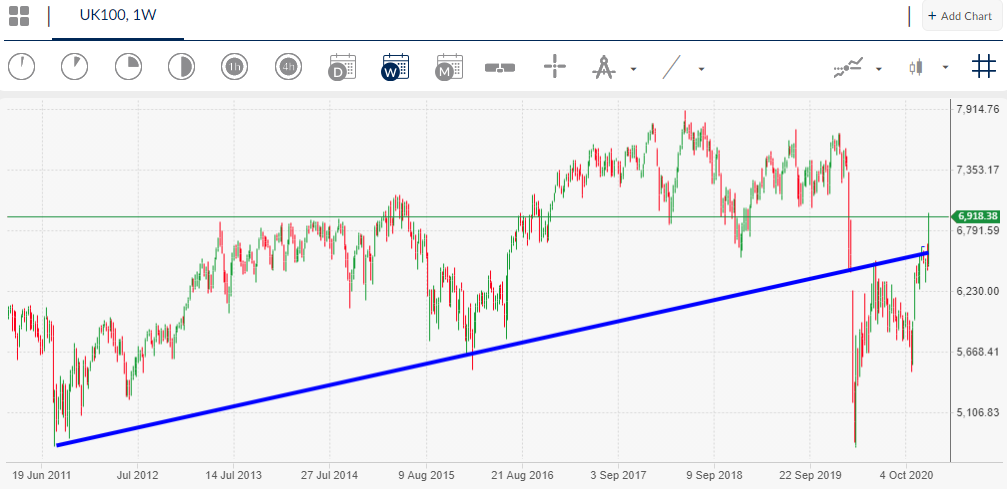
Still, from a technical perspective the FTSE100 look very bullish at the moment, and could well be headed towards the 7,000 level, and possible even the 7,400 level if the bullish momentum in the index continues.
FTSE100 Technical Analysis
The lower time frames show that a head and shoulders pattern has been invalidated on the lower time frame, following the recent break above the 6,640 level.


