Weekly Index Analysis
UK FTSE100
The FTSE 100 is a market-capitalisation weighted index of UK-listed blue-chip companies. The index is part of the FTSE UK Series and is designed to measure the performance of the 100 largest companies traded on the London Stock Exchange that pass screening for size and liquidity. FTSE 100 constituents are all traded on the London Stock Exchange’s SETS trading system.
5 of the top constituents to the FTSE100 are:
AstraZeneca – Pharmaceuticals and Biotechnology
See real-time quotes provided by our partner.
AstraZeneca is now world famous as being a major part of the global vaccination against COVID-19. The share price has been in a correction recently but is finding support around the 8180 level.
Unilever – Personal Care Drug and Grocery Stores
See real-time quotes provided by our partner.
The Unilever daily chart appears to be showing a distribution patter, which should be a warning to anyone long this share. A break below the recent support level of 3700 would most probably result in further downside. For the bulls this could be a great buying opportunity of course, and a quick close back inside the range would indicate they were still in control. However, anyone long now, would be looking for price to test towards the 4700 before they can relax.
Diageo – Beverages
See real-time quotes provided by our partner.
Diageo benefitted from the stay-at-home drinkers during lockdown but had to also deal with a loss of revenue from the pubs and clubs. The share price reflects the bulls taking the stairs and having recently popped higher out of a consolidation period the support between 3400 and 3500 is now key to maintaining this upward trend.
HSBC Hldgs – Banks
See real-time quotes provided by our partner.
I recently wrote how HSBC are looking to concentrate their efforts toward wealth management and the far east and that they recorded better than expected revenues this last quarter. The share price has broken out of a descending channel and further bullishness should come with monetary policy tightening from the US and the UK as the economies continue to grow. A close around 415 to 420 should be enough to make old resistance then act as support.
GlaxoSmithKline – Pharmaceuticals and Biotechnology
See real-time quotes provided by our partner.
Technically GSK is my favourite chart today, as the breakout after a small consolidation period is very bullish, but better still there is room above before price meets the next resistance zone. 1510 – 1530 may prove to be the next roadblock but investors will have been able to limit their risk by then.
The FTSE100 is also home to the largest names in mining and energy names, but consumer staples and financials are the two largest constituent sectors.
The London Stock Exchange website offers a heatmap, so you can visually take the temperature of the index in an instant.
![](https://youtrading.com/en/wp-content/uploads/2021/08/FTSE-heatmap-2.png)
When most of the companies are in the green, it’s obvious that the index should be rising. However, if the 5 largest companies by index weight are down on the day, this can be enough to cap further upside for the index.
Trading the FTSE100 on the ActivTrader platform is through the UK100 CFD and this tracks the underlying index.
The current consensus of the retail traders on the ActivTrader platform is that the UK100 should be coming down, as 89% of them are short according to the sentiment indicator.
These extreme readings that show a retail bias is used as a contrarian indicator and looking at the daily chart, anyone short this product will be feeling some pain today.
See real-time quotes provided by our partner.
The last breakout higher was around the beginning of April 2021 which then saw the FTSE rise around 4% to be capped by the mid-June 2021 highs. There was a pullback which inevitably the savvier investors used as a buying opportunity at the liquidation of weak hands who were long, and price has risen since. Now that the FTSE100 is breaking higher a move above 7218.81 opens a measured move towards 7500 at least, with the 7670 coming in at the 161.80% Fib extension.
![](https://youtrading.com/en/wp-content/uploads/2021/08/Indices-1.png)
2021 has been a frustrating year for the FTSE100 as it lags the performance of the German DAX, S&P500, Dow Jones Industrial Average and the Nasdaq. July 19th was a pivotal moment for the FTSE as the UK lifted all government mandated COVID-19 restrictions. Since then, the UK economy has benefitted as much as could be expected considering the world is still dealing with bottleneck, supply chain disruptions and self-isolation of employees.
Year to date, the FTSE100 is up 14.37% but it still has a long way to go before reaching the 2018 all-time highs, unlike the other mentioned indices that have been making regular new all-time highs of late.
See real-time quotes provided by our partner.
The hope for all FTSE100 bulls is that the monthly close is positive and if we were to base the forward expectations on the price trading above the monthly Ichimoku cloud for some time, we could use this indicator to limit our downside and potentially maximise the upside. When prices make a new high comparative to the previous candle this is good momentum and placing your SL under the previous down candles low, is also a great way to limit your downside risk. The ActivTrader platform also comes with a momentum indicator and while that is pointing higher and above the signal line this should act as confirmation that you’re trading in the right direction.
See real-time quotes provided by our partner.
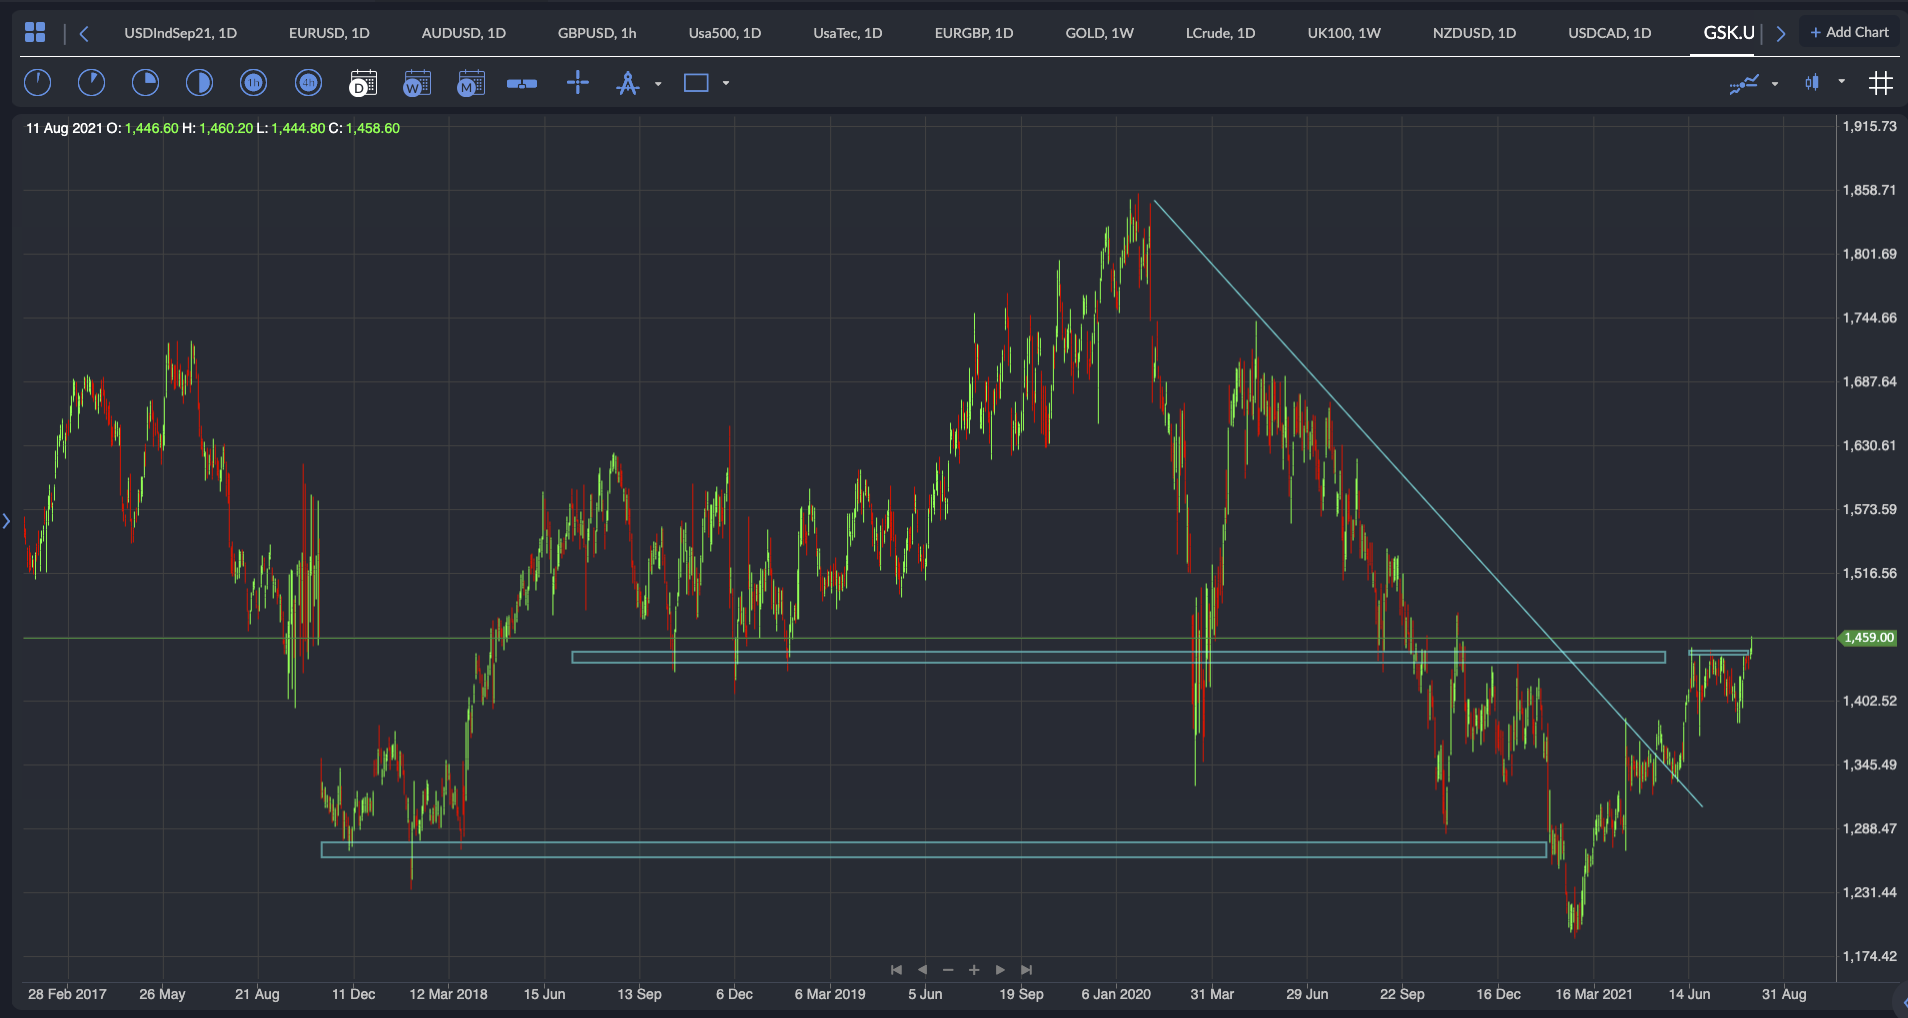
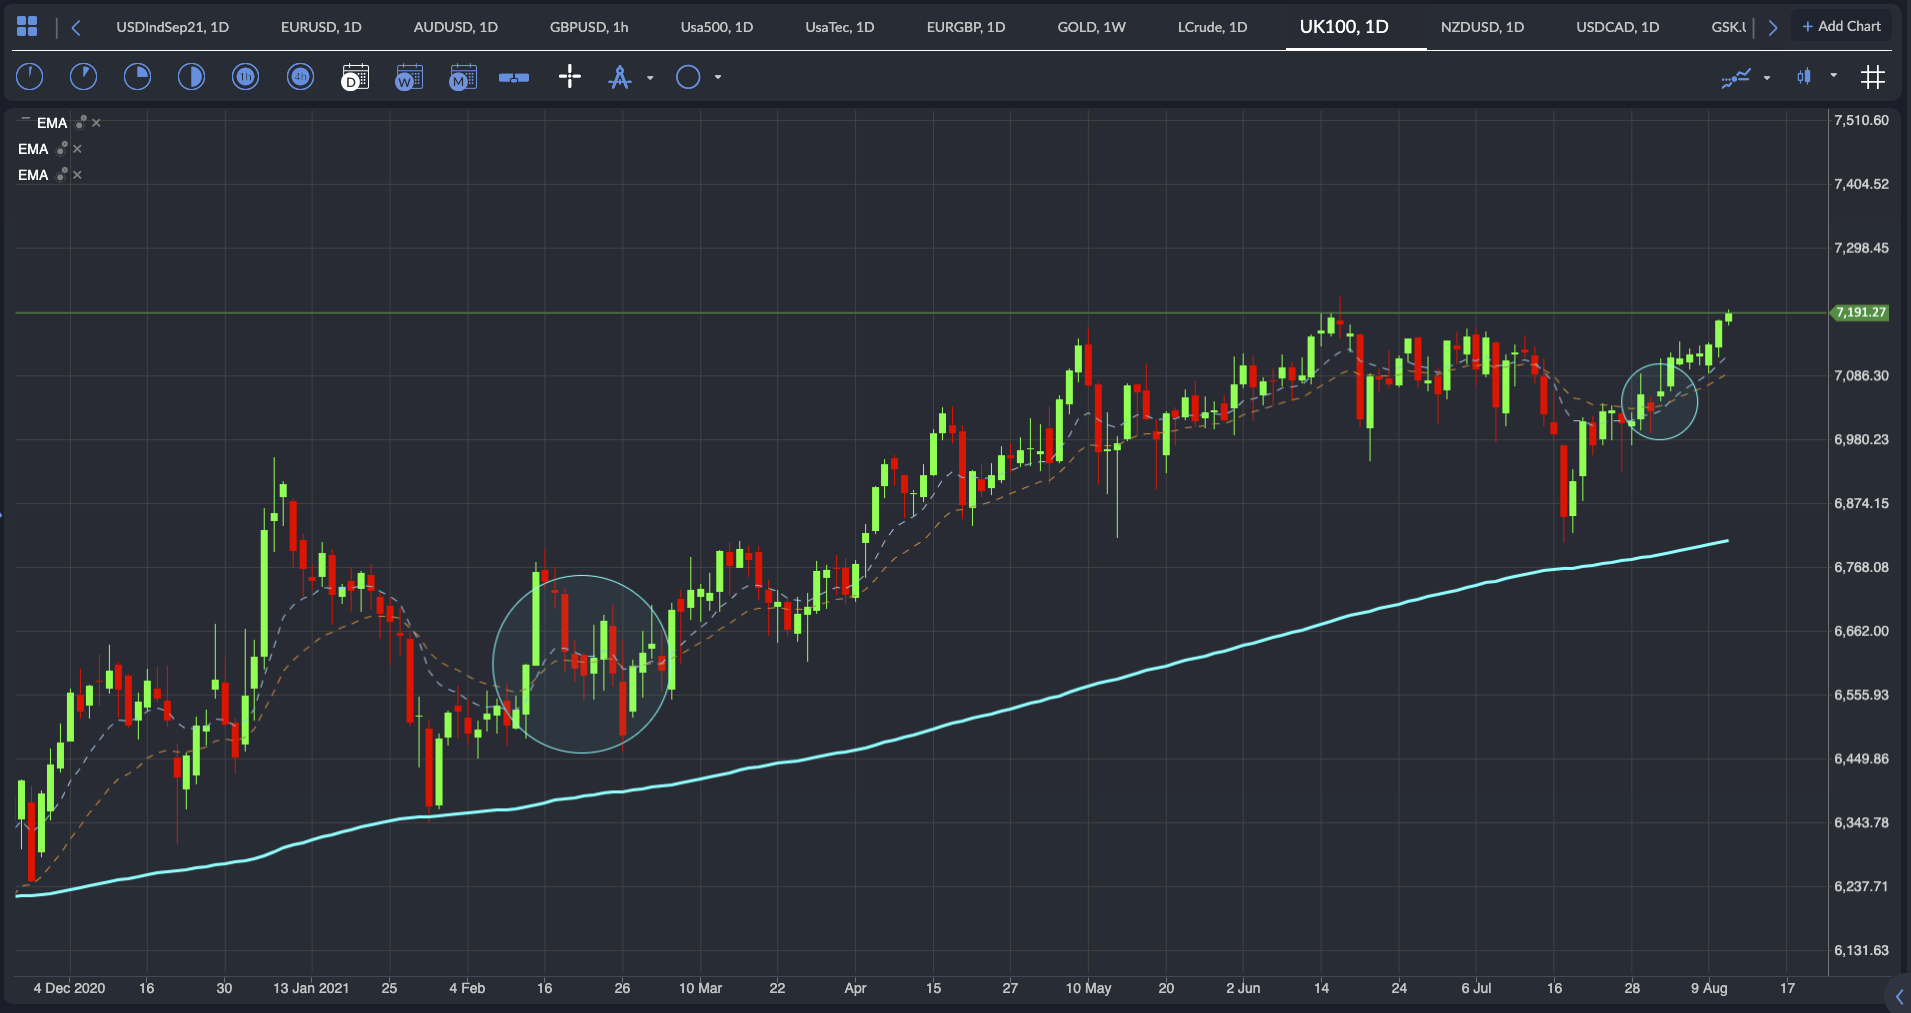
Another way to trend follow is to have a few exponential moving averages, which ever you usually use are fine. The idea is to have 2 smaller momentum indicators in combination with a larger directional indicator. On the above chart the 10 & 20 daily ema are acting as momentum indicators, so when the 10 is above the 20, prices are heading in a bullish fashion. This combined with price being above the daily 200 ema, means that the momentum, price action and larger trend are all in sync and looking for buying opportunities is best.
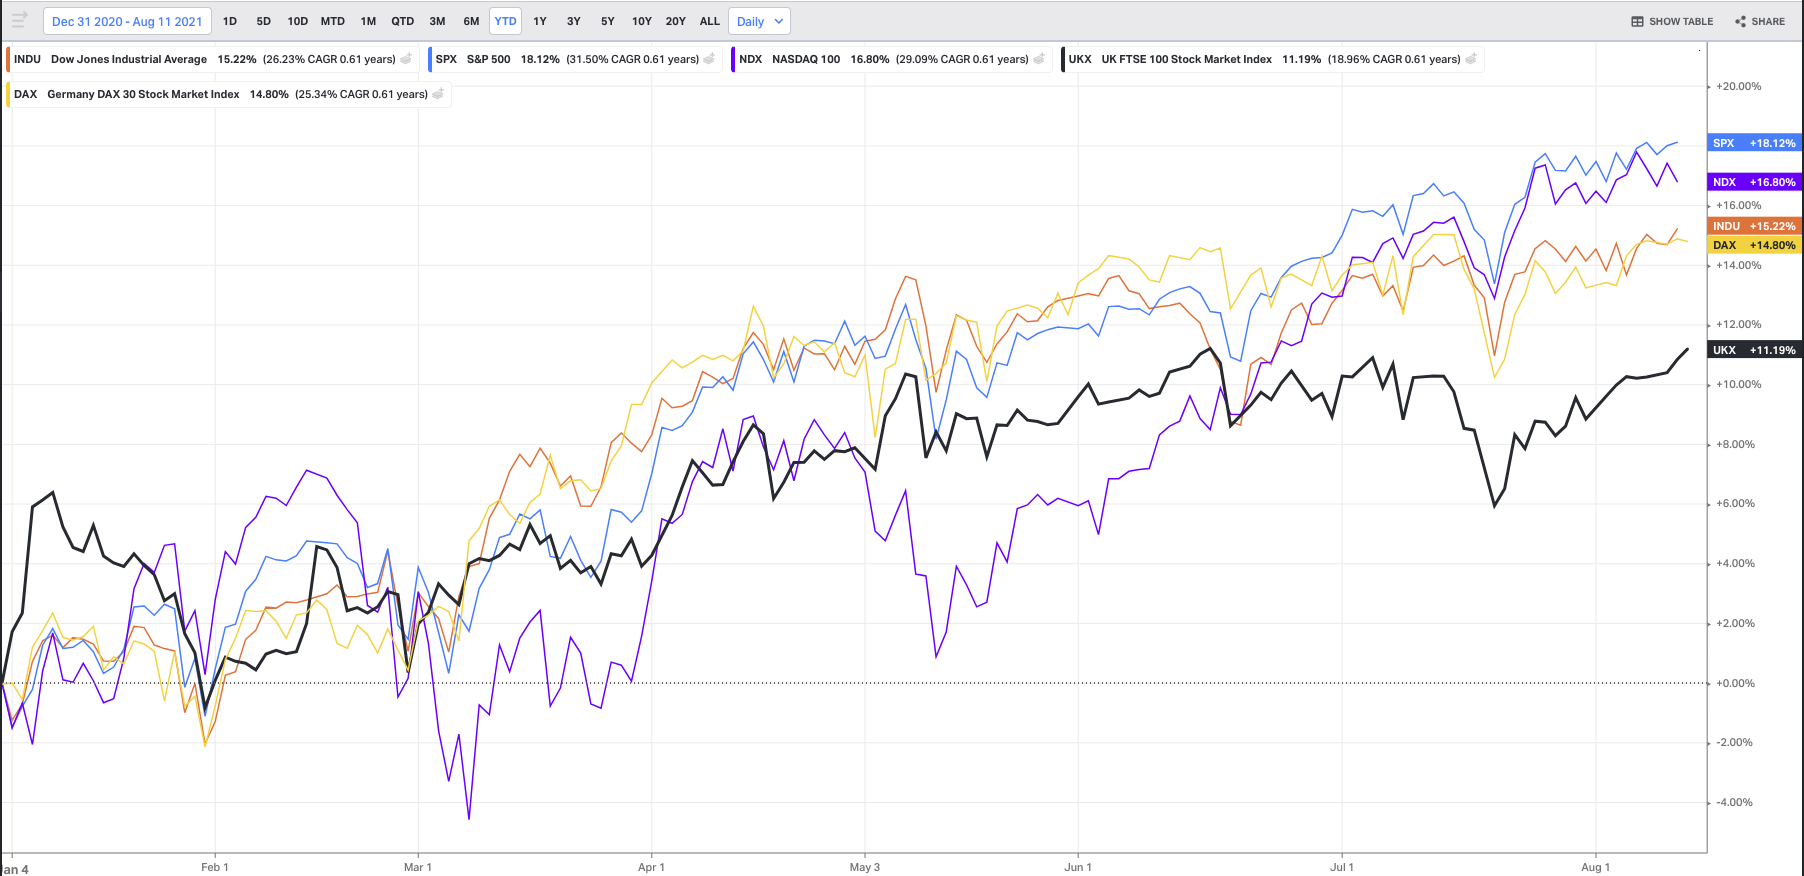
Fundamentals and sentiment will have a major impact on all assets and currently the underlying markets are emerging from the depths of the pandemic, so things are relatively bullish. The US is about to sign off on more fiscal stimulus and the UK is at heard immunity, so hopefully we will benefit from a rising global economy and not be subjected to further lockdowns. Having the fundamental analysis supporting a trading thesis is key, and then the technicals can be used as a timing device and a way to maximise value and limit risk.