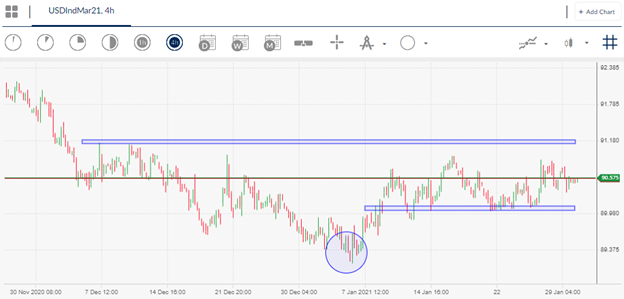
The US Dollar Index is poised for a major directional move on the foreign exchange market over the days and weeks ahead, as a number of major currency pair’s look set to breakout against the greenback after weeks of back-and-forth trading action.
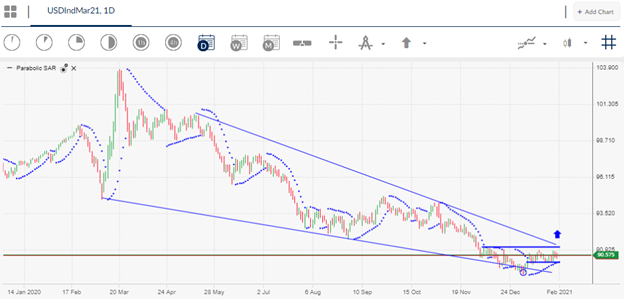
According to technical analysis, the US Dollar Index has been in a bearish market trend since late-May last year. A bearish trend is defined by an asset class trading below its key 200-day moving average.
In terms of fundamentals, the US Dollar Index has been sold by traders due to the fact that the Federal Reserve have dramatically increase their balance sheet since COVID-19 as they began implementing QE4.
Other factors that have weighed on the greenback during its downtrend has been the massive COVID-19 stimulus packages from the US government, and major bouts of uncertainty towards US politics.
The US Dollar Index has started to stabilize after months of losses, and now looks set to stage a potential comeback. The only concerning for traders with the US Dollar Index long trade is the prospect of the massive $1.9 trillion stimulus package that the US Democrat party may soon unleash on the US economy.
According to most analysts, the bullish case for the greenback at present comes from the prospect of improving US economy, rising inflation, and safe-haven inflows from COVID-19 concerns and also Wall Street’s fears over stocks declining.
During the financial crisis of 2008 the US Dollar Index surged as traders sold stocks and flocked into the buck. With the ongoing fears about Main Street versus Wall Street, stock certainly also has the ability to move market lower. This could benefit the US Dollar Index.
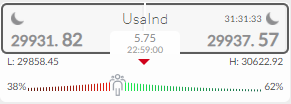
According to the ActivTrader Market Sentiment tool traders are bullish towards the US Dollar Index. Retail traders typically exit emerging trends too earlier or lean against prevailing market trends. This does not mean that these traders are always on the wrong side, but we should remind ourselves that the overall trend is still to the downside, and the US Dollar Index could squeeze somewhat lower before staging a bullish breakout.


