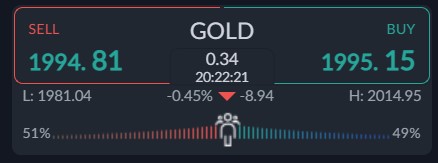
Gold continues to pullback after the recent comments from Fed member Waller caused rate hike expectation to increase, which prompted a move back in the US dollar currency broadly.
Of course gold is the anti-dollar trade, and we always usually see an inverse price correlation, so when the US dollar is moving higher we should naturally expect gold to move lower.
Gold has started to weaken in early-week trade again as traders await more Fed speak. Fed’s member Barkin increased the uncertainty on Monday after saying he “Wants further evidence that inflation is settling back to target.”
Barkin added that the “Economy operating just fine current level of rates” and “He’s reassured by what he’s seeing in the banking sector”. Again, his comments did little to lift gold price.
On the positive side is the long-awaited decline in shelter is expected to start to make its way into the economy. In addition, bank loans are expected to decline in the economy is expected to slow in the second half of the year which should also be a headwind toward lower inflation.
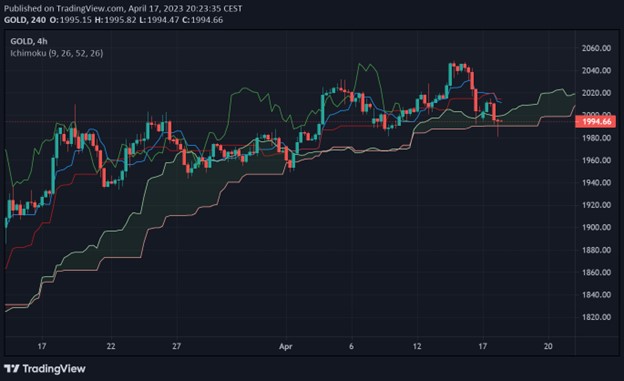
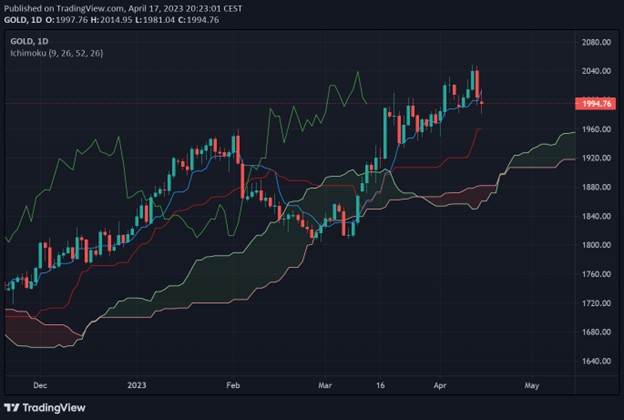
Going forward, its imperative that gold price move back above $2,000 or else we could see a steep drop back to the $1,960 support zone in the coming days and weeks.
Current sentiment metric towards gold shows that sentiment less bearish all of a sudeen, which hints that this current price action is probably bearish, but a stepper correction may not happen as the sentiment bias is not that severe.
The ActivTrader market sentiment tool shows that just 49 percent of traders are bullish towards gold. Going forward, we really need to see a much strong negative bias by retail to help the chances of a sustained rally.
Gold short-term Technical Analysis
According to technical analysis gold the price of gold has moved below its 200-period moving average, meaning that the short-term price trend remains very bearish below the $1,990 level.
It is also noteworthy that gold has broken inside the Ichimoku Cloud and the price now needs to move above the $2,020 level to force the next major breakout. A move under $1,980 would be very bearish in the short-term.
Gold Medium-term Technical Analysis
The daily chart shows that the yellow-metal has moved under the $2,000 level and is now track back towards the $1,960 support area. Below here there is no support until $1,920.
We could see the price of gold making new highs if it ignites the inverted head and shoulders pattern as depicted in the chart below. Gold could explode above the $2,070 level and then the $2,100 level with relative ease.