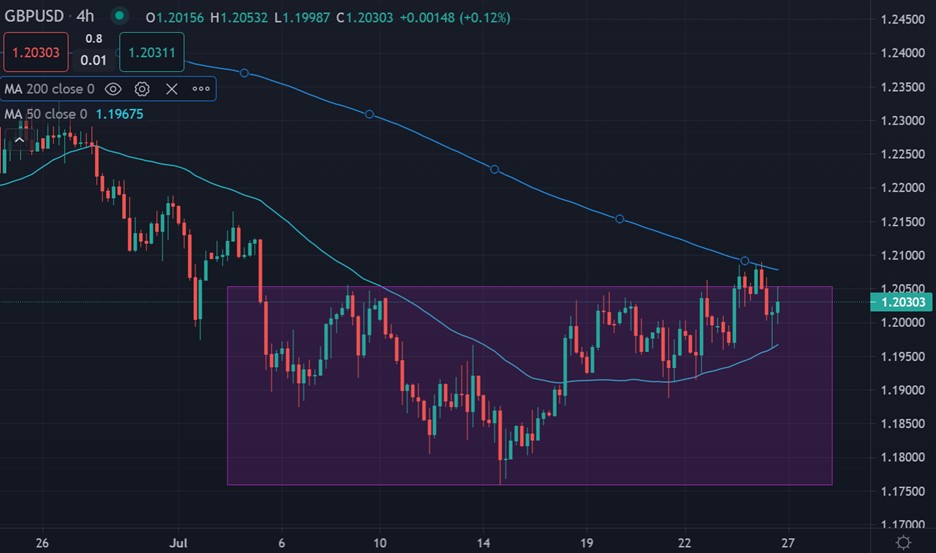
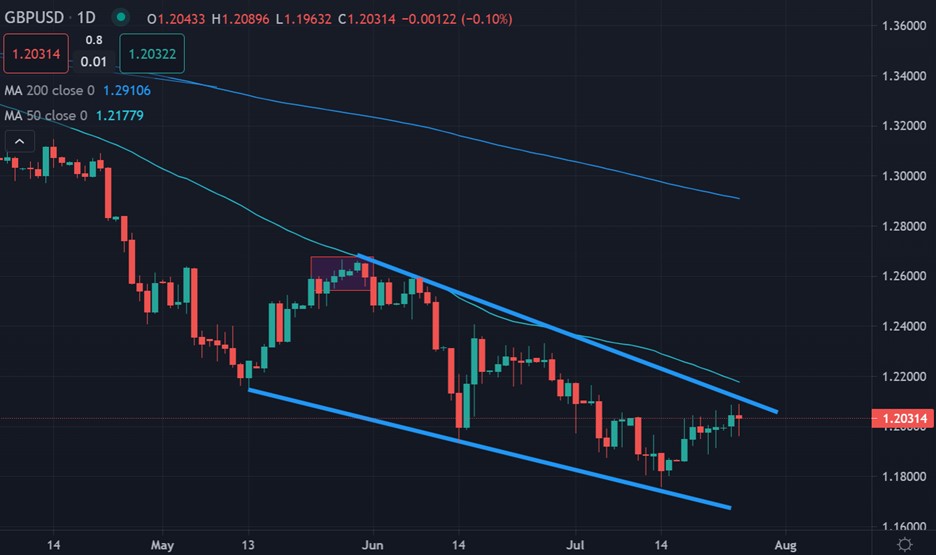
The British pound currency has started to move back above the 1.2000 level against the US dollar after appearing to find hard resistance from the 1.2100 level ahead of the Bank of England meeting this week.
A big drop in the EURGBP pair appeared to aid the British pound earlier this week as the euro sunk and investors scrambled for safer currencies as the energy crisis looms over Europe.
This week the Bank of England could raise rates by as much as 0.5% as the central bank of the United Kingdom pledge to get inflation under control as food and energy price spiral higher.
Recently the Governor of the UK central bank Andrew Bailey said such a move is “not locked in”. The Bank is tasked with trying to wrestle that figure back down to 2%.
CPI inflation data from the UK today is expected to show June’s inflation picked up from May’s 40-year-high of 9.1%. Some analysts are even predicting that inflation in the UK could rise above 10 percent.
Mr Bailey noted that a 50-basis point rise – from 1.25% to 1.75% – will be one of the options for the Monetary Policy Committee when it next decides on rates on 4 August.
And that” if we see signs of greater persistence of inflation, and price and wage setting would be such signs, we will have to act forcefully.”
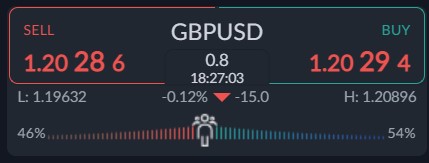
Looking at sentiment data and how traders feel about sterling, the ActivTrader Market Sentiment tool shows that traders are growing neutral, despite the recent price volatility.
With 54% of traders are currently bullish, it should be noted that this current sentiment reading is significant enough to be an extreme reading, as traders are now basically neck and neck in terms of positioning.


