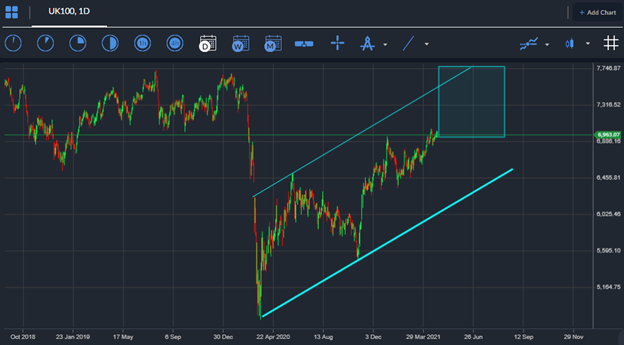
The UK100 performed its highest monthly price close since February 2020 as traders shrugged-off a mini-market meltdown in US and Asian stock markets on Friday. The FTSE100 also posted its second-highest weekly price close of 2021 last Friday.
Bullish news surrounding UK house prices helped the FTSE100 close the month in relative style compared to European markets. UK house prices increased the most in since 2004 in April., while data showed that the April number completely reversed negative sentiment after March’s 0.3% price dips.
The UK housing market received a strong boost after UK Chancellor Sunak announced supportive measures inside his last budget, including a stamp duty holiday and government back 5 percent mortgages.
This is significant because the UK housing mortgage is hugely important to the health of the UK economy. It should also be noted that rising consumer spending is directly linked to the United Kingdom housing market.
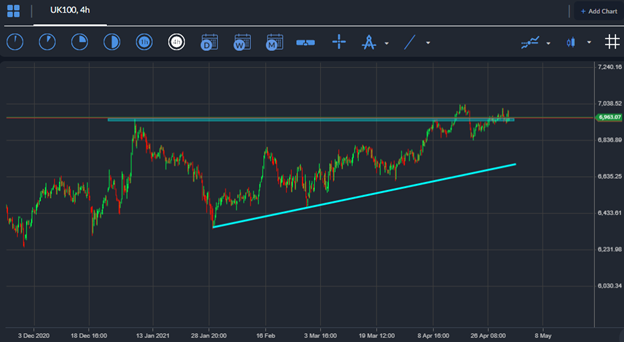
Looking ahead at this month the FTSE100 index really needs to forge a meaningful breakout above the 7,000-resistance barrier in order to prompt increased technical buying and cement the notion that the early-year breakout is alive and well.
Additionally, the Bank of England meeting this week could be bullish for the UK stock market if the UK central bank refuse to remain in cautious mode and cut bond purchases, and also reaffirm their intention to keep interest rates low.
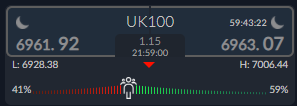
FTSE100 Sentiment Analysis


