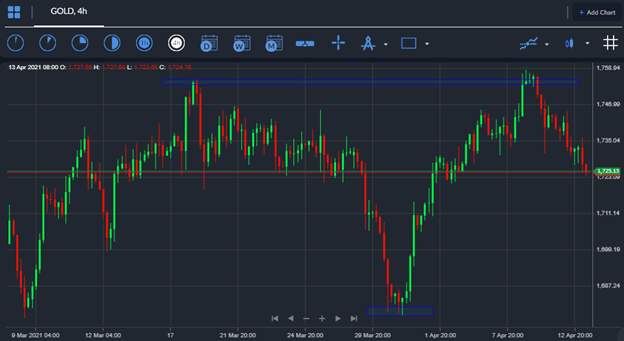
The price of gold failed to follow through to the upside, following last weeks unexpected move above the March 3rd swing high, around the $1,756 level. A lack of buying demand above the key breakout zone is the main issue for gold bulls right now.
Additionally, the herd are still overly bullish towards the yellow metal, with the ActivTrades sentiment tool highlighting a distinct positive skew right now amongst gold retail traders.
It should also be noted that the Momentum and the MACD indicators are showing both showing negative price divergence extending down towards the $1,720 level, which means gold may need to lower before it heads higher again.
Still, the lack of buying interest above the key former swing high is a concern for gold bulls, especially given that the general consensus is that the FED will keep its foot on the presses and also keep rates low.
Should we see more positive data from the US economy this week, in terms of inflation, retail sales, and jobs data, then the gold long trade certainly has the potential to be unwound further, and the yellow metal could be looking sub $1,700 again.
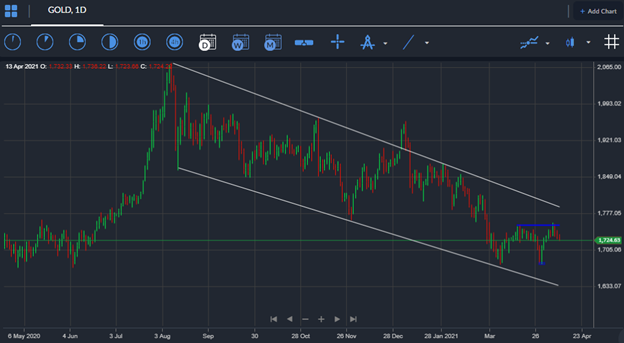
The saving grace for gold right now is price patterns. The lower time frame showed that a notable bullish reversal pattern has formed and is highlighting a potential run towards $1,840. However, if the price of gold drops below $1,675 and the pattern is invalidated, then it could be disastrous for gold.
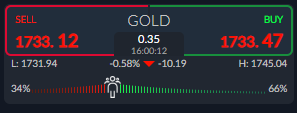
Current sentiment towards gold on the ActivTrader Market Sentiment tool shows that traders are still bullish towards gold with sentiment at 66 percent positive. This is an increase of nearly ten percent since last week.
This is bearish in the short-term, because overly positive sentiment is reaching elevated levels and doing the opposite of what retail traders are doing has historically proved to be a very profitable strategy.


