The New Zealand dollar is on the slide against the US dollar currency due to the RBNZ as it appears increasingly likely that the upcoming rate hike will be the last in the current cycle due to weaker inflation data.
New Zealand CPI growth slowed down from the prior quarter’s 7.2% yoy, registering a 6.7% yoy increase, falling short of the expected 7.0% yoy. The largest contributor to the annual inflation rate was the food sector, followed by housing and household utilities.
On a quarterly basis, CPI rose by 1.2% qoq in Q1, below the anticipated 1.5% qoq increase, marking the lowest result in two years. Vegetables and fruit were the primary drivers of food prices, rising by 8.6% and 11%.
This data is the preferred measure of the inflation gauge of the RBNZ, and these figures came in lower than RBNZ’s forecast of 1.8% quarter-on-quarter and 7.3% year-on-year inflation.
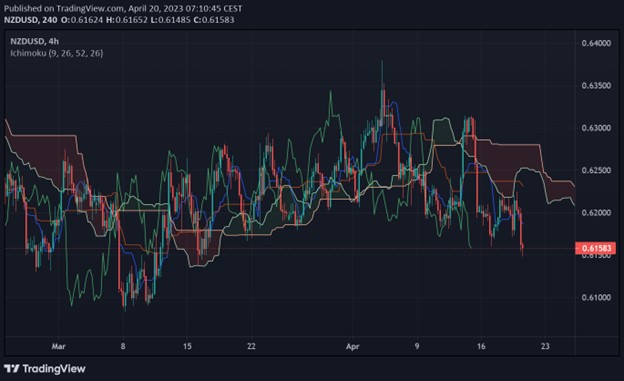
Despite the sharp drop, I do think the NZDUSD pair is currently signs of a price bottom. However, we really need to see more confirmation as the global economy is still poor, which is something that could affect the performance of the NZDUSD pair.
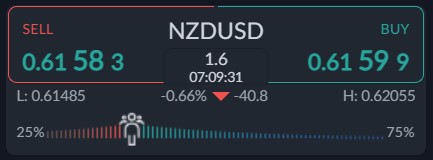
According to the ActivTrader market sentiment tool, some 75 percent of traders are bullish towards the NZDUSD pair. As we typically look to fade sentiment biases, this could mean the NZDUSD pair could continue to reverse lower.
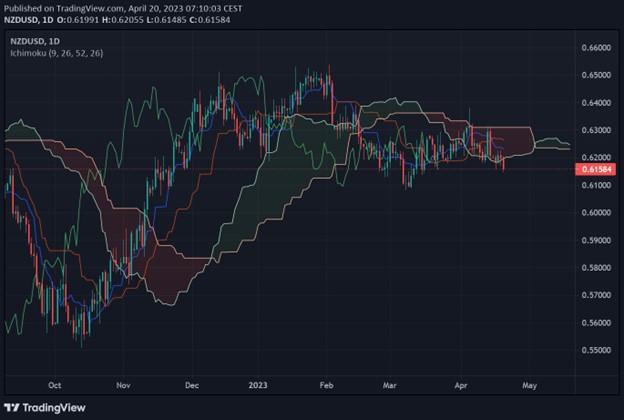
It is worth mentioning that high levels of bullish sentiment suggest a classic contrarian sentiment trade is still in the making, so do be careful buying this pair at the current level, especially since the dip under the 200-day moving average today.


