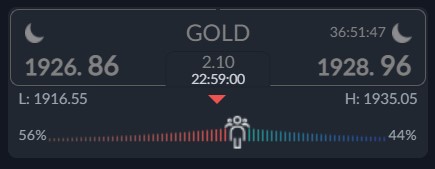
Gold pulled back from just show of the $1,950 resistance level as traders used the overshot to the upside as an excuse to book some profits ahead of the Fed rate decision later this week.
The key takeaway from today’s PCE inflation index report was that the core PCA index declined in December by 0.3%. The preferred inflation index used by the Federal Reserve was at 4.7% year-over-year in November and declined to 4.4% year-over-year last month.
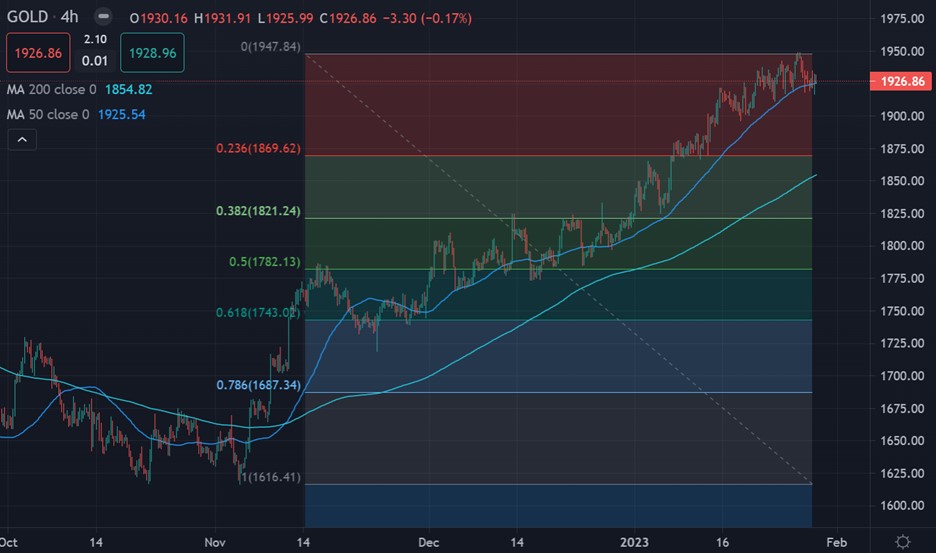
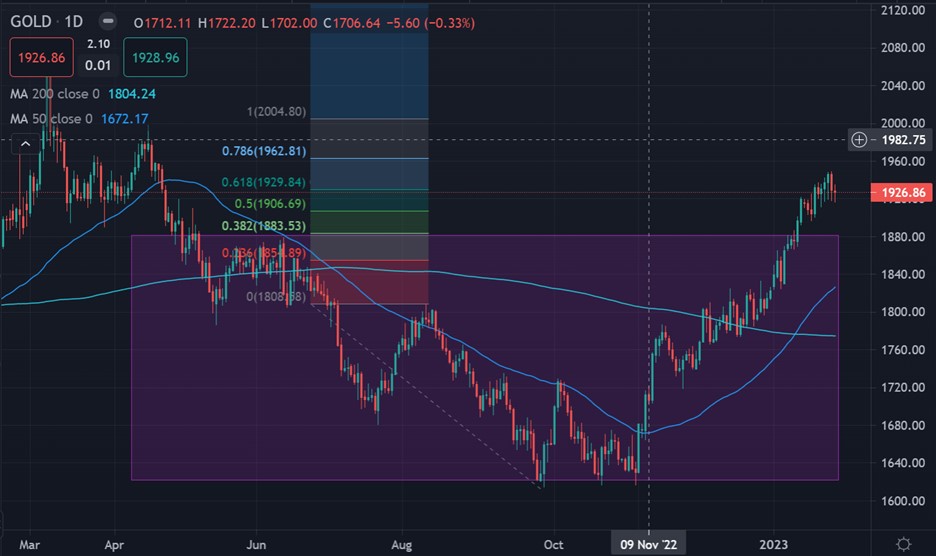
Going forward, if we see the price of gold trading above the $1,950 level for a significant amount of time I would expect a test towards the $1,980 to $2,000 area next month.
For now, the yellow metal does look prone to a correction as it has gained 5 percent in value this year already. Any corrections are likely to be seen as a strong dip buying opportunity.
A significant breach of the $1,920 area and I would expect the price of gold to crash quite quickly under $1,880 and then basically to recover with some gusto back to current levels.
Bank of America believe that gold could be well bid for around the next three years and to eventually test the $2,000 level. Based on current economic trend this is highly likely in my opinion.
Current sentiment metric towards gold shows that sentiment has become not so bullish, which still hints that retail are leaning towards more gains this week.
The ActivTrader market sentiment tool shows that 56 percent of traders are bearish towards gold. Going forward, we really need to see a much stronger negative bias by retail to help the chances of $2,000 being hit.
Gold short-term Technical Analysis
According to technical analysis gold the price of gold could head towards $1,870 level as it continue s to make a correction from the best levels of the year so.
The key moving averages are showing the may forward, with a break under the 50-period moving average on the 4-hour time frame likely to spark a 200-period moving average test, around $1,860.
See real-time quotes provided by our partner.
Gold Medium-term Technical Analysis
The daily chart shows that the yellow-metal has fit hard Fibonacci resistance, with the yellow-metal testing the 0.168 Fibonacci extension of the 2022 low to the August 2022 swing high.
The 100 Fib extension is more interesting. It is actually located around the $2,000 level. A chance exists on the charts for a test of the $1,840 area or the 200-day moving average, around $1,770.
See real-time quotes provided by our partner.