The US dollar is in recovery mode against the Swiss franc currency and is now approaching some extremely important technical levels on the price chart. A number of technical signs are warning that the USDCHF pair could rally sharply if the 0.9000 resistance level is breached.
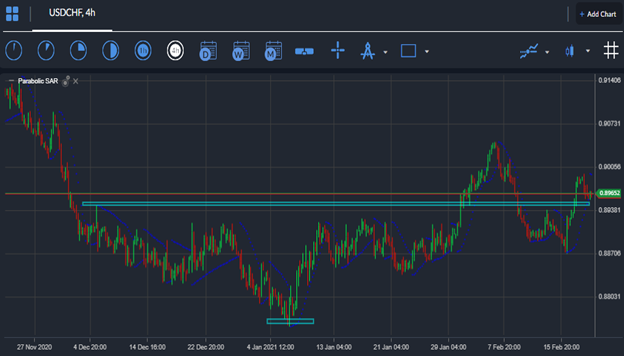
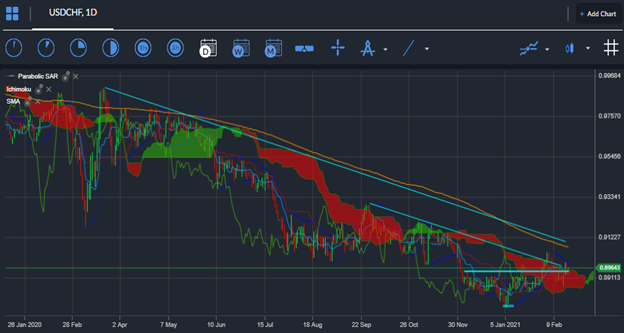
Positive and negative signs still exist for the USDCHF pair. The technicals are improving in the short-term as the USDCHF pair is technically bullish above its 200-period moving average, around the 0.8900 level, however, the overall trend is still bearish while the USDCHF remains trapped below its trend defining 200-day moving, at 0.9150.
Looking at the recent history of the USDCHF, the pair has been slowly moving higher after forming an important technical bottom around the 0.8750 level earlier this year. Both lower and higher time frame analysis shows that the USDCHF pair has been making higher highs and lower lows.
Typically, the USDCHF pair has an inverse relationship with the EURUSD pair. So, it is also important to keep a close eye on what happens to the EURUSD. It is also noteworthy that the USDCHF pair is very much still a safe haven play.
We should also consider that the USDCHF pair has a strong correlation with US bond yields. Rising United States bond yields should be very supportive for the US dollar going forward if they continue on an upward trajectory.
With risk sentiment remaining at elevated levels, it is generally not supportive for the Swiss franc currency. What we probably need to see is a pure US dollar play, and a continuation of strength in greenback to continue to help lift the USDCHF pair above the 0.9000 level.


