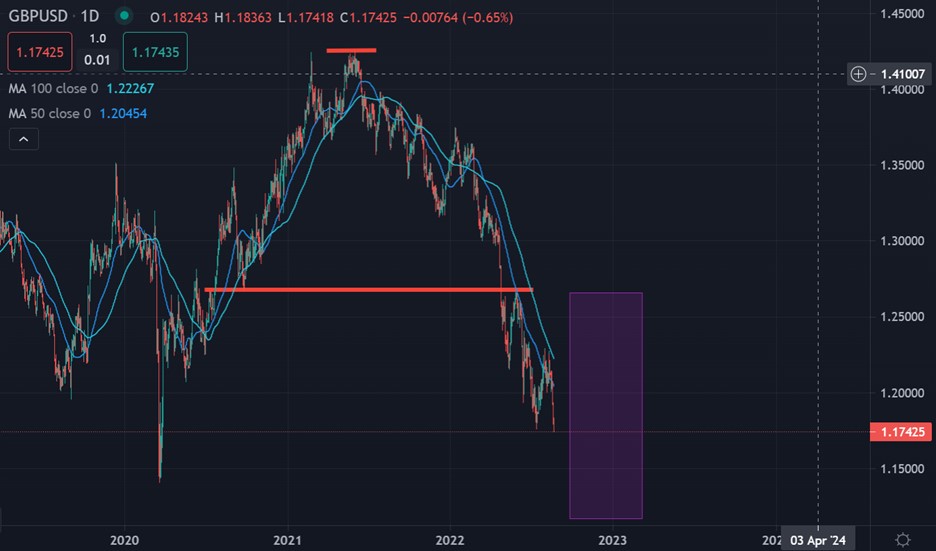
The British pound currency has started to move back to levels not seen since the start of Brexit against the US dollar as the looming energy crisis and US dollar index breakout accelerates.
Yesterday, a 13% rise in European benchmark natural gas prices spooked markets that the cost of living crisis is going to be even worse than initially forecasted. Citibank has also released an investment note saying UK inflation is on course to rise 18.6% year-on-year in January.
This dealt a very worrying blow to the market as last week the Bank of England grabbed headlines with a forecast of 13% at the turn of the year. Now Citibank are saying this could be a much, much worse crisis.
The forecast is largely based on natural gas prices and doesn’t take into account potential mitigation strategies from the government. The current level of the energy cap is £1971 per year. They see it rising to £4567 in January and £5816 in April.
Citibank states that “Even with the economy softening, last week’s data reaffirmed the continued risk of pass through from headline inflation into wage and domestic price setting could accelerate.” For the record, inflation that high would break the 1979 peak and push the country into recession.
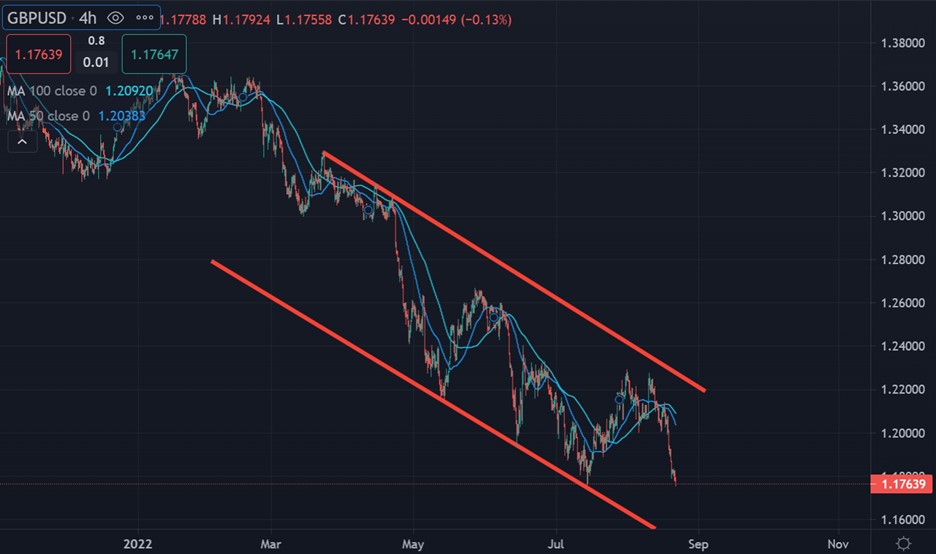
Such a move could place further stress on sterling. We are also seeing some signs in the charts that the GBPUSD pair could be headed towards below the 1.1000 technical levels.
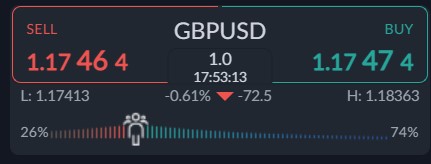
Looking at sentiment data and how traders feel about sterling, the ActivTrader Market Sentiment tool shows that traders are growing more bullish, despite the recent price crash.
With 74% of traders are currently bullish, it should be noted that this current sentiment reading is significant enough to be an extreme reading, as traders are now basically increasingly bullish bets. This is a very negative sign for sterling.


