The price of copper is starting to rebound as precious metals receive a boost from a weaker US dollar, which is starting to take a hit as the market expects the Fed to slow down the pace of rate hikes.
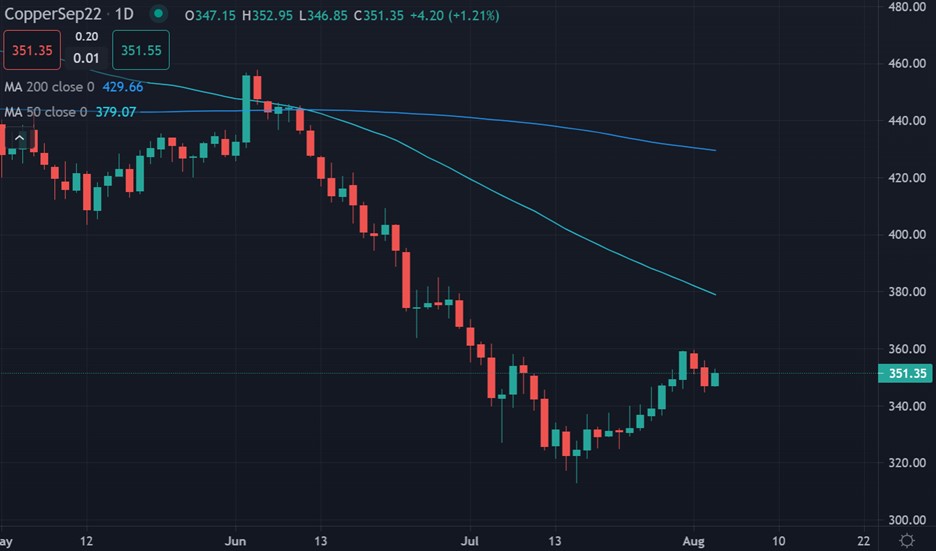
Most traders would agree that copper has been in a bear market since breaking under its 200-day moving average this year, following last year’s big run higher towards the $500.00 area.
This year, weakness in the global economy, especially in China, and demand issues, plus a major downtrend over recent weeks in gold has harmed the red-metals short and medium-term prospects.
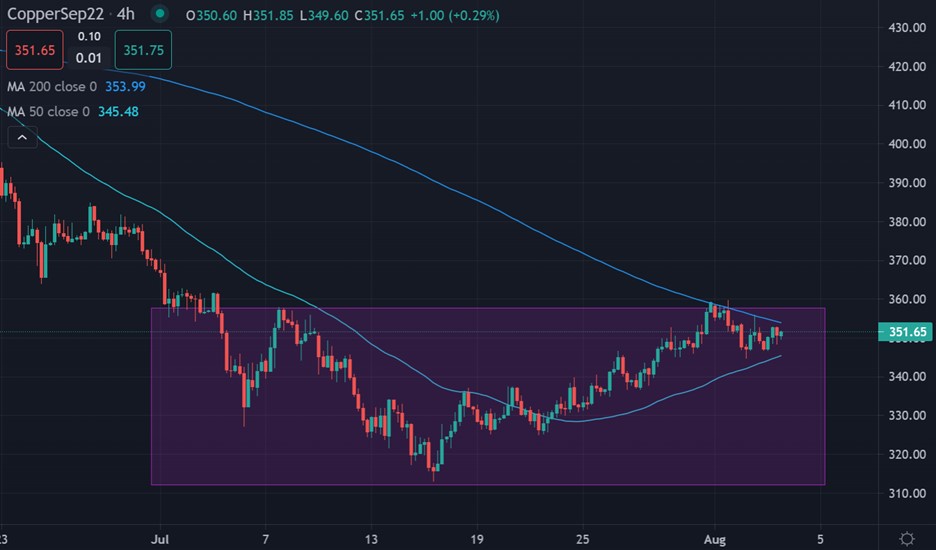
The recent defense of the $300.00 benchmark area encouraged technical buyers back in the market. I strongly believe that we could be about to see a run-in copper back towards $380.00 or even $400.00.
Much of the upside progress will of course depend on economic data and also how the market dynamics involving copper, such as supply, and demand are in the coming days and weeks ahead.
Sentiment towards copper has been the biggest risk in the market over recent months as the market turned heavily bullish towards the red metal. Basically, sentiment is now neutralized.
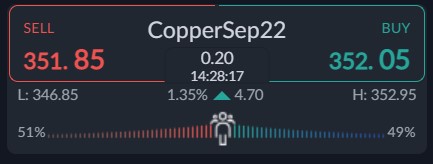
According to the ActivTrader platform some 49 percent of traders are bullish towards Copper. This is a massive 20 percent drop over recent weeks. I believe more short-term range bound trading in the red metal seems the most likely scenario.


