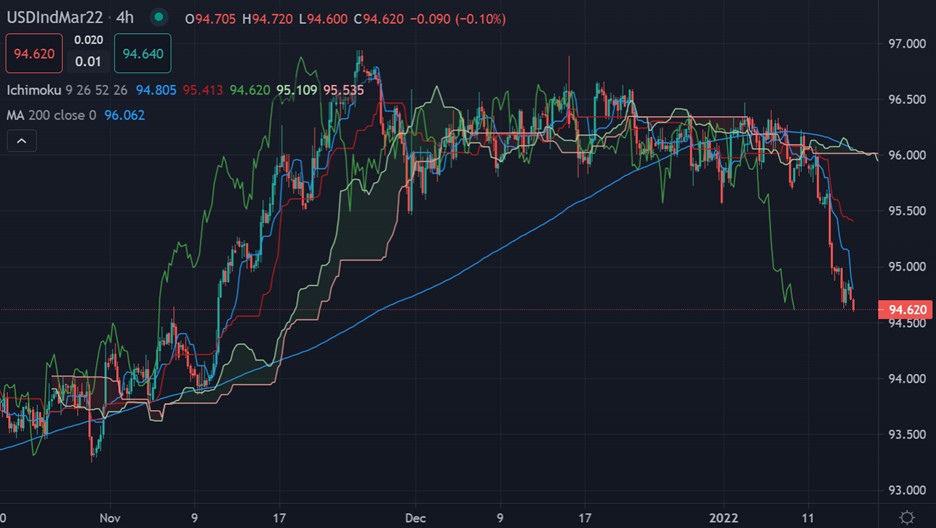
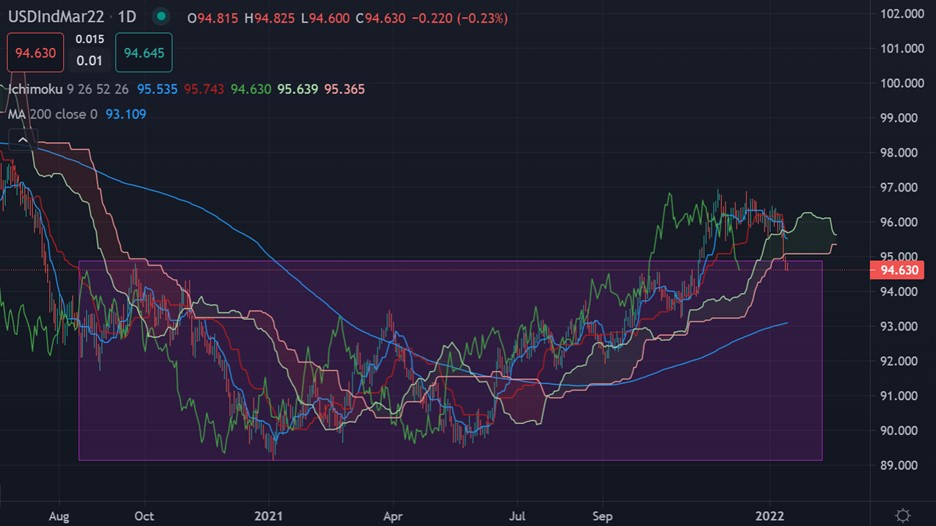
The US dollar index is sliding rapidly lower on the foreign exchange market, as the recent reversal from just below the 97.00 handle shows few signs of stopping any time soon.
We are currently seeing one of the largest sentiment biases towards the greenback. With the majority of retail traders appear to be getting crushed by this latest leg lower in the buck.
Later I will expand further on the sentiment metrics according to the ActivTrader platform. For me, I will discuss why the US dollar index is embarking on another round of selling.
The US dollar index closed the third straight day in the negative territory largely due to the decline in the annual Producer Price Index seen in the December PPI inflation report.
This is a similar effect we saw on Wednesday, where traders are selling the buck when inflation data is not coming in as hot as expected. This is because FED rate hike expectations are decreased.
Additionally, the greenback struggles to find demand as the benchmark 10-year US Treasury bond yield fell nearly 2%, putting additional weight on the world’s reserve currency.
Later today we see December Retail Sales, Industrial Production data and the University of Michigan’s advance Consumer Sentiment Index for January. Expect more volatile moves in the buck.
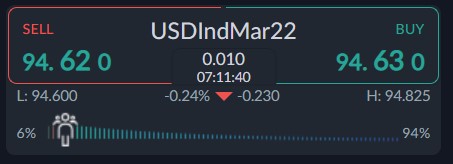
The ActivTrader market sentiment tool is showing that some 94 percent of traders are bullish towards the US dollar index. This is bad news bulls as typically such overstretched sentiment from the retail crowd usually hints at an ongoing short squeeze on retail traders.


