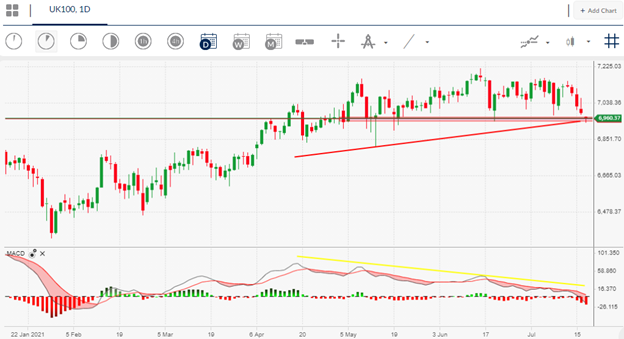
The FTSE100 dropped below the 7,000-level last week as fears about the increasing number of new COVID-19 cases from the new Delta variant caused a broad-based market sell-off inside the leading UK index.
A very grim finish to last week across the leading European stocks dragged the FTSE100 into the red, and even the release of better-than-expected US retail sales data on Friday could not boost UK stocks as investors focused intensely on the spike in COVID-19 cases.
Major oil companies on the FTSE100 such as Shell and BP also had a difficult session as oil prices continued their multi-day decline. FTSE100 oil companies may be affected by the latest news that OPEC have agreed a production increase over the weekend.
The FTSE100 index also saw a breakdown with its usually inverse price correlation with Sterling last week. Both the British pound and the FTSE100 moved lower on Friday, this normally only happens when extreme risk aversion comes into the market.
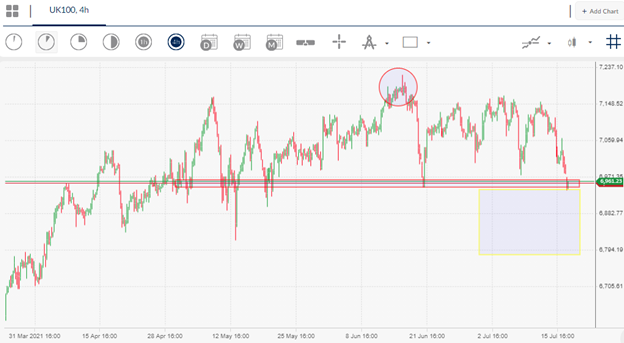
This week the market will be searching for more news about the COVID-19 variant. The technical are pointing to a pending price drop towards the 6,800 level all the time while the FTE100 trades under the 7,000 level.
It should be noted that the FTSE100 never really look very comfortable above the 7,000 level, and genuinely lacked the buying power to break into a new and much higher trading range above the psychological 7,000 level.
FTSE100 Sentiment Analysis
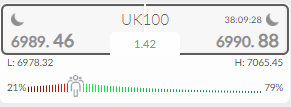
The Market Sentiment indicator on the ActivTrader platform currently shows that some 79 percent of traders are bullish towards the FTSE100 right now. This could indicate that the FTSE100 will just continue lower, as the retail crowd is typically wrong about the direction of the market.


